
iTechGuides is reader-supported. When you buy through links on our site, we may earn an affiliate commission. As an Amazon Associate I earn from qualifying purchases. Learn more
An “Unexpected token <” error usually means your client received an HTML document where it expected JSON. Before changing parser code, inspect the response itself: its status, Content-Type, final URL, redirect history, and a short preview of the raw body. Those clues help distinguish a wrong route, an authentication page, an API error handler, or a proxy response.
What to check first
Record what the client actually sent and received. A URL that contains /api/ is not proof that the intended API handler received the request; a wrong host, path prefix, route, or environment can lead to a frontend page or another unrelated response. Compare the full request URL and method with the API’s documented route. Cloudinary’s Admin API documentation is one service-specific example of why the exact endpoint and request requirements matter.
- Request: method, host, path, and environment.
- Response: status code and
Content-Type. - Navigation: redirects and the final URL after the client follows them.
- Body: a short raw preview, not just the parser’s error message.
An HTML preview can reveal whether the response is a login form, a frontend app shell, or a server or proxy error page. A redirect can obscure the original response: a client that follows it may show the destination page instead of making the original authentication or routing problem obvious. The status, content type, final URL, and body signature are useful clues, but none proves the cause in every stack. For the general symptom and inspection approach, see this HTML response troubleshooting explainer.
Which layer might be returning HTML?
Wrong URL or frontend fallback
If the host or route is wrong, the request may reach a website rather than an API endpoint. A frontend router can serve its standard HTML app shell for a path that it does not recognize. Check the actual URL sent by the client—not only a URL assembled in code—and compare its host and path with the API documentation.
Do these 3 things before closing this tab:
1Fix the driver behind crashes, sound loss and screen glitches2Repair Windows errors before they cause bigger problems3Scan for outdated or missing drivers - takes under a minuteAuthentication or authorization
An API request that lacks credentials or formats them incorrectly may receive an HTML login or error page. Cloudinary specifically identifies missing or incorrectly formatted credentials as common reasons its Admin API returns HTML instead of the expected JSON. Its documentation also calls out incorrect Base64 encoding when manually constructing the Authorization header. This is a Cloudinary-specific example, not a universal explanation: verify the authentication requirements for the service you are calling. Cloudinary Admin API documentation
#1 Best Overall

- 【High-Speed 8-Channel Analysis】Captures digital signals at up to 24MHz across 8 channels, enabling precise debugging of complex protocols like I2C, SPI, and UART—ideal for advanced STEM projects without the limitations of basic 4-channel models.
- 【User-Friendly Design】Base module and breakout board simplify connections to breadboards, microcontrollers, and other setups.
- 【Logic Level Expansion Board】Breaks out all 8 channels to 2.54mm male pins and pads for alligator clips, enabling flexible and secure connections in diverse projects.
- 【Logic Level Breadboard Adapter】 Easily connects the logic analyzer to breadboards, providing direct and convenient access to all 8 channels for prototyping and testing.
- 【Dual USB Connectivity】Comes with both USB-A and Type-C cables for universal compatibility with older PCs, modern laptops, and devices, ensuring hassle-free plug-and-play across Windows, Mac, Linux, and Ubuntu.
API error handling
The API itself can return HTML when an endpoint fails. Microsoft’s ASP.NET Core documentation describes a client expecting JSON receiving an unhandled-exception response with Content-Type: text/html. It also explains that an API can be configured to return JSON for missing endpoints and unhandled exceptions. If you own the API, check its exception and not-found handling so its error responses follow the documented machine-readable contract. Microsoft’s ASP.NET Core API error-handling guidance
Proxy or intermediary
A proxy in the request path can affect routing or produce its own error response. If a proxy is involved, inspect its configuration and diagnostics as well as the API server’s logs. Postman recommends using its Console to review proxy-related request information during troubleshooting. Postman’s request troubleshooting documentation
Rank #2

- ✅ High-Performance 16-Channel Logic Analyzer: Cost-effective LA1010 USB logic analyzer with 16 input channels and 100MHz sampling rate per channel, featuring portable design and included KingstVIS PC software.
- 🌐 Real-Time Signal Visualization: Simultaneously capture 16 digital signals and convert them into clear digital waveforms displayed instantly on your PC screen for precise analysis.
- 🔍 Protocol Decoding & Data Extraction: Decode 30+ standard protocols (I2C, SPI, UART, CAN, etc.) to extract human-readable communication data, accelerating debugging.
- 🛠️ Multi-Application Tool: Ideal for developing/debugging embedded systems (MCU, ARM, FPGA), testing digital circuits, and long-term signal monitoring with low power consumption.
- 💻 Cross-Platform Compatibility: Supports Windows 10/11 (32/64bit), macOS 10.12+, and Linux – drivers auto-install, no configuration needed.
Follow a practical diagnostic sequence
- Verify the request target. Capture the method, host, path, and environment the client used. Compare them with the API’s documented route; do not assume a path that merely looks like an API path reached the API.
- Read the response metadata. Note the status and
Content-Type, then inspect a short raw-body preview. A login form, app shell, or error text can point toward a different layer. - Check redirects. Review the redirect history and final URL. If the client followed a redirect, determine whether the destination is a login page or another unexpected route.
- Verify authentication. Confirm that credentials are present and that the authorization format matches the service’s instructions. For Cloudinary’s Admin API, check the required credential formatting, including Base64 encoding if you construct the header manually.
- Inspect the proxy path. If a proxy is involved, review its routing and diagnostics. In Postman, the Console can help expose proxy-server request information.
- Correct API error responses if you control the server. Configure missing-route and exception paths to return the API’s documented machine-readable response rather than an HTML page.
- Parse only after checking the representation. Preserve the status and response details when parsing fails; do not silently catch the error and hide evidence that the body was HTML.
Use the response clues together
Compare the observations rather than treating one header or status as conclusive. An HTML body with a login form and a redirect to a sign-in route points toward authentication; an app shell with an unexpected final URL suggests a route or frontend fallback; an exception page may indicate server-side error handling; and proxy diagnostics can indicate an intermediary response. These are diagnostic patterns, not guarantees—confirm the responsible component using the request path and the relevant service, framework, or proxy documentation.
The Tool Desk
Outbyte Driver Updater FREEScan for outdated or missing drivers - takes under a minuteDriver Scan →Outbyte PC Repair FREEClear out junk files and repair common Windows errorsFree Scan →Quick Recap
Best Value

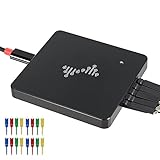
- ★The logic for each channel sampling rate of 24M/s. General applications around 10M, enough to cope with a variety ofoccasions; 8-channel.
- ★Sampling rate up to: 24 MHz , can be 24MHz. 16MHz, 12MHz, 8MHz, 4MHz, 2MHz, 1MHz, 500KHz, 250KHz, 200KHz, 100KHz, 50KHz, 25KHz.
- ★Input voltage range: -0.5V to 5.25V; Input Low Voltage: -0.5V to 0.8V; Input High Voltage: 2.0V to 5.25V.
- ★Input Impedance: 1Mohm || 10pF (typical, approximate); Crystal: +/-20ppm, 24MHz.
- ★UART, SPI, IIC and other communication debugging, let you get twice the result with half the effort. 24M sampling rate, can automatically analyze UART, IIC, SPI and many other standard protocols.
Rank #4
- 16 channels dual-mode support: ①Stream mode captures and transfers data in real time for long sample duration; ②Buffer mode captures and stores data temporarily for high sample rate
- USB 2.0 Type-C interface with up to 16G sample depth in stream mode
- Support for adjustable threshold and shielded wires for a better, cleaner waveform
- 256Mbits on-board SDRAM memory with multiple buffer modes
- Compatibility with WinXP-Win10, macOS, and Linux, supporting nearly 100 protocol decoders, and being open-source on Github
Rank #3

- The logic for each channel sampling rate of 24M/s. General applications around 10M, enough to cope with a variety ofoccasions; 8-channel
- Sampling rate up to: 24 MHz , can be 24MHz. 16MHz, 12MHz, 8MHz, 4MHz, 2MHz, 1MHz, 500KHz, 250KHz, 200KHz, 100KHz, 50KHz, 25KHz;
- The logic for each channel sampling rate of 24M/s. General applications around 10M, enough to cope with a variety ofoccasions;
- Input voltage range: -0.5V to 5.25V; Input Low Voltage: -0.5V to 0.8V; Input High Voltage: 2.0V to 5.25V
- Input Impedance: 1Mohm || 10pF (typical, approximate); Crystal: +/-20ppm, 24MHz
Product prices and availability are accurate as of the date/time indicated and are subject to change. Any price and availability information displayed on Amazon at the time of purchase will apply.

