
AI-driven multimodal fusion combines complementary evidence—such as equipment measurements, asset records, weather, and inspection images—to help utilities detect problems, investigate causes, and prioritize inspections. It can give engineers a broader view than a single sensor or image, but it does not guarantee an accurate diagnosis or maintenance recommendation. The practical goal is better-informed human decisions, not automatic control of the grid.
What does multimodal fusion mean for grid maintenance?
“Multimodal” means using different kinds of data together so a model or workflow can assess more than one view of an asset or event. A utility might combine operating measurements with asset history and weather context, then compare those records with imagery from an inspection. Each source can answer a different question: what the equipment is doing, what condition it was in before, what conditions it faced, and what an inspector can see.



The International Energy Agency (IEA), in Modernising Grids in the Age of Electricity (2026), groups grid AI tasks into forecasting, detection, diagnosis, screening and prioritization, simulation, and optimization. For maintenance, inspection, and planning, these are generally decision-support jobs: identifying what deserves attention and helping staff decide what to inspect or investigate.
That distinction matters. Finding an anomaly is not the same as determining its cause, estimating when an asset will fail, or deciding to take it out of service. Those are separate tasks with different evidence and consequences.
Quick wins for a faster PC:
Fix the driver behind crashes, sound loss and screen glitchesFind Drivers →Repair Windows errors before they cause bigger problemsFix Now →Scan for outdated or missing drivers - takes under a minuteDriver Scan →#1 Best Overall

- 【New-Gen Multi-Sensor Fusion Edge AI Chip】Hidden camera detectors equipped with multi-sensor AI chip, it runs lightweight deep learning algorithms locally without cloud computing. The chip cross-analyzes RF radio waves, magnetic induction and infrared lens reflection data simultaneously, intelligently filter interference from routers, mobile phones and household electronics, cutting false alarms by over 90% while locking pinhole cameras, wireless bugs and magnetic GPS trackers accurately.
- 【9-in-1 Complete Privacy Guard】Combines 9 practical detection & alert functions, covering hidden camera scanning, RF signal detection, magnetic GPS tracker locating, audio bug tracing, infrared lens recognition, laser detection night vision camera, electromagnetic interference filtering, SOS emergency alarm and abnormal motion detection. camera detector works perfectly in hotels, offices, vehicles, fitting rooms and meeting rooms to block all potential privacy threats comprehensively.
- 【6 Levels of Sensitivity & Precise Target Locating Scan Mode】Hidden camera detector features six levels of adjustable detection sensitivity, Adopts segmented signal attenuation positioning technology, Built-in high-brightness concentrated IR light array amplifies tiny lens reflections, even ultra-mini pinhole cameras concealed in wall holes can be visually pinpointed without extra auxiliary tools. Perfect for deep inspection of Airbnb rooms, fitting rooms and business vehicle interiors.
- 【3-in-1 AI Sentinel Alarm System& Green Night Vision Laser】Once the radio frequency detector abnormal motion, and the spy detector will emit vibration, buzzer sound and strobe triple alarms. A self-developed cat-e ye night vision detection algorithm keenly captures infrared nanometer wave signals from hidden cameras; laser full-area scanning combined with a green light guide precisely locks onto night vision lenses, leaving no place for various hidden pinhole night vision cameras to hide.
- 【Fast Charging & Ultra-Long Standby】Privacy pen upgraded large-capacity 2000 mAh low-power consumption lithium battery, within 1 hour via Full charge quickly (compatible with phone power bank, laptop charger). Achieves continuous 8-hour non-stop scanning or can achieve 50 days of long standby time when not in use. No need to carry extra dedicated chargers during cross-city business trips, overseas travel or long road trips; solves the trouble of frequent power loss of traditional detectors.
What data can utilities combine?
Potential inputs include operational measurements, asset records, weather data, customer data, and images. For visual analysis, the IEA describes computer-vision methods applied to drone, satellite, LiDAR, and inspection imagery. Such analysis can help identify vegetation encroachment, ice sleeves, wear, corrosion, fatigue, or storm damage. The IEA’s general characterization is that automated review can be faster—and in some cases more precise—than manual review; it is not a guarantee for every asset, image, or utility.
The National Laboratory of the Rockies’ Artificial Intelligence for the Power Grid page describes vision models processing high-resolution imagery from drones, ground cameras, and satellite or aerial sources to capture information about grid assets, including possible physical wear. This describes research capability, not a quantified field trial.
Operational measurements can add a different perspective. The U.S. Department of Energy’s Big Data Synchrophasor Analysis page, surfaced as a 2022 source, reported that more than 2,500 phasor measurement unit (PMU) locations had been deployed across the U.S. bulk power system. The page also described eight projects selected in 2019 to explore big data, AI, and machine learning on PMU data for grid operation and management. The 2,500-plus figure is a historical figure reported on that page, not a current deployment count or a measure of maintenance-system adoption.
Can combining thermal and visual inspections find line problems earlier?
It may help inspection teams assess different kinds of evidence together, but the available examples do not establish a universal improvement in detection time or field accuracy. A 2026 IEEE conference abstract proposes a transmission-line framework that combines visual defects, thermal anomalies, corona-discharge regions, and spatial-clearance risks. Its intended tasks include detecting defects, locating anomalies, and assessing risk.
The proposal illustrates why different inspection cues can complement one another: a visible defect, a thermal anomaly, and a clearance concern are not interchangeable observations. The abstract describes a proposed method and reported experiments; it does not establish broad utility deployment or independently comparable field performance.
A thermal camera can capture thermal evidence for an inspection. It is an input device, not the fusion system: by itself it does not combine readings with visual imagery, asset history, or operating conditions, nor does it generate a validated maintenance recommendation.
Can AI predict when a transformer needs maintenance?
Multimodal analysis can be used to investigate transformer condition, but the evidence cited here does not establish a dependable, generally available system that predicts when any transformer needs maintenance. A 2026 IEEE conference abstract proposes a transformer fault-diagnosis approach combining vibration, acoustic-emission, dissolved-gas-analysis, and partial-discharge measurements, with inference at the edge. The abstract does not provide enough detail to support a comparative performance claim or show field adoption.
Diagnosis and prediction should not be conflated. A model that flags a pattern associated with a possible fault may help engineers decide what to examine; a prediction about remaining useful life or a maintenance date requires evidence and validation for that specific claim.
Recommended Free Tools
How can multiple data sources help locate an outage?
Fusion is also relevant beyond inspecting one asset. A National Laboratory of the Rockies record for a peer-reviewed 2025 paper, Integrated Framework of Multisource Data Fusion for Outage Location in Looped Distribution Systems, describes a framework that combines network structure and multiple evidence sources using probabilistic graph methods. It reports validation on two modified public test systems.
Rank #4
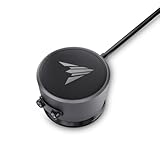
- A sensor designed specifically for AC Infinity AI Controllers to monitor the presence or absence of water.
- Allows AI controller to provide leak detection, alerts, and advance controls via the AC Infinity app, triggering water devices as needed.
- Versatile mounting options with both secure suction and powerful magnetic attachments for maximum adaptability.
- IP68-rated to guarantee the sensor is safeguarded against continuous immersion in water up to 3 meters in depth.
- This sensor is engineered to enhance various settings, from aquariums to industrial water tanks, providing a versatile solution for monitoring and managing water levels.
This is a bounded research result for outage location in looped distribution systems, not proof that the method will perform the same way across operating networks. It also addresses locating an outage, which is distinct from predicting equipment maintenance needs.
What does a practical maintenance workflow look like?
A useful fusion workflow starts with a decision the utility needs to make, rather than with a decision to collect more data. A reasonable sequence is:
- Define the task. Specify whether the system should flag a possible defect, help diagnose a cause, or rank assets for inspection. Do not treat those outputs as interchangeable.
- Choose relevant evidence. Match data to the task—for example, inspection imagery for visible condition, thermal readings for heat anomalies, and asset or operating records for context.
- Check data quality and context. Confirm that records refer to the same asset and relevant time period, and that missing, inconsistent, or poor-quality inputs are visible to reviewers.
- Validate the output for its intended use. Test whether the model or workflow behaves reliably on conditions and assets relevant to the utility, rather than assuming a result from a proposal or test system transfers directly to the field.
- Keep review and follow-up explicit. Route findings to planners, engineers, or operators who can check the evidence, decide whether further inspection is warranted, and document the decision.
The IEA says lower-risk uses—such as forecasting, maintenance, inspection, and planning tools—are scaling first because they improve decisions and workflows without directly controlling the power system. It states: “Lower-risk AI applications, such as forecasting, maintenance, inspection and planning tools, are scaling first because they improve decisions and workflows without directly controlling the power system.”
Best Value
Does adding more sensors make grid maintenance more accurate?
No—not by itself. Additional sensors can provide useful evidence, but value depends on whether the measurements are relevant, reliable, correctly associated with an asset, and interpreted for a clearly defined task. More inputs can also introduce gaps or conflicts that a workflow must handle. A single well-chosen signal may be more useful than several poorly matched ones; the cited sources do not provide a consistent head-to-head test establishing which fusion approach performs best.
Readiness depends on more than the number of inputs. The IEA highlights validation, explainability, cybersecurity, fallback rules, and accountability as increasingly important as AI moves from workflow support toward automated control. The greater the system’s influence over grid operation, the stronger those safeguards need to be.
How mature is the evidence?
The examples span different kinds of evidence, so they should not be treated as equivalent demonstrations of a deployed maintenance product.
| Example | Inputs and task | Evidence described |
|---|---|---|
| Grid imagery analysis | Drone, satellite, LiDAR, and inspection imagery; identify possible asset conditions. | IEA synthesis and a National Laboratory of the Rockies capability description; no quantified field trial is specified in those descriptions. |
| Transmission-line inspection | Visual, thermal, corona-discharge, and spatial-clearance cues; detect defects, localize anomalies, assess risk. | 2026 IEEE conference abstract describing a proposed framework and reported experiments; broad deployment and independently comparable field performance are not established. |
| Outage location | Multiple evidence sources plus network structure; locate outages in looped distribution systems. | Peer-reviewed 2025 framework validated on two modified public test systems; performance across real networks is not established by that result. |
| Transformer fault diagnosis | Vibration, acoustic emission, dissolved-gas analysis, and partial discharge; diagnose faults with proposed edge inference. | 2026 IEEE conference abstract; the surfaced description does not establish comparative performance or field adoption. |
These examples show research and institutional activity across several tasks. They do not demonstrate one universal multimodal system, establish a vendor ranking, or guarantee a maintenance outcome.
What’s actually slowing this PC down?
Pick the symptom - the matching free tool is one click away.
Quick Recap
Product prices and availability are accurate as of the date/time indicated and are subject to change. Any price and availability information displayed on Amazon at the time of purchase will apply.

