
Free tools Windows power users keep installed
One-click scans. No signup required.
Gray-scale degradation is a proposed way to handle borderline trading signals: reject scores below a minimum threshold, reduce exposure when a score only just clears it, and reserve full sizing for stronger signals. Kestrel Quant describes this approach for algorithmic cryptocurrency trading, but the published account does not independently demonstrate that it improves trading results.
What changes when execution is no longer binary?
In binary threshold execution, a signal either clears a cutoff and receives the strategy’s ordinary treatment or fails the cutoff and is rejected. That creates a sharp boundary: a score barely above the threshold may be treated like a much stronger one.
| # | Preview | Product | Price | |
|---|---|---|---|---|
| 1 |

|
Fundamentals of Risk Management: Understanding, Evaluating and Implementing Effective Enterprise... | $41.66 | Buy on Amazon |
| 2 |
|
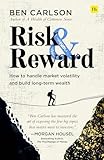
Risk and Reward | $15.54 | Buy on Amazon |
| 3 |

|
I Got Stuck with Risk Management - the Non-Expert's Guide | $19.95 | Buy on Amazon |
| 4 |

|
Against the Gods: The Remarkable Story of Risk | $14.70 | Buy on Amazon |
| 5 |

|
Risk: A User's Guide | $23.96 | Buy on Amazon |
Kestrel Quant’s proposed Gray-Scale Degradation Mechanism keeps a hard rejection zone but grades accepted signals by conviction. The idea is to make risk allocation reflect how far a score is from the acceptance threshold rather than treating every accepted signal alike.
How the three conviction zones work
| Zone | Score treatment described by Kestrel Quant | Position and stop treatment |
|---|---|---|
| High conviction | Above 70 | Full position sizing and standard stop-loss parameters |
| Marginal conviction | Above the acceptance threshold but below 70 | Scaled-down position sizing and a dynamically tightened stop-loss |
| Noise | Below the acceptance threshold | Hard veto; no trade |
The article says a decay function maps the score’s distance from the threshold to a position-size multiplier. It does not publish the complete function or explain how to calibrate it. The zone boundaries therefore describe the proposal, not a ready-to-copy trading rule.
Recommended Free Tools
#1 Best Overall
Binary execution versus graded risk budgeting
| Consideration | Binary threshold execution | Graded risk budgeting |
|---|---|---|
| Near-threshold scores | Accepted or rejected at the cutoff; scores that pass may receive the same treatment. | Accepted scores below the high-conviction band are treated as marginal. |
| Exposure to marginal signals | No graduated sizing is described; passing signals receive ordinary treatment. | Position size is scaled down according to a decay function, whose formula is not stated. |
| Stop-loss handling | Standard parameters for accepted trades in the comparison presented by Kestrel Quant. | Marginal signals receive dynamically tightened stops; the exact adjustment rule is not stated. |
| Implementation complexity | Threshold-based decision logic. | Additional score-to-size and stop-adjustment logic; Kestrel Quant describes event-driven middleware with precomputed lookup tables. |
| Evidence needed to judge results | A controlled evaluation is still needed to establish performance. | A controlled comparison is needed; the article does not provide one. |
The proposed trade-off is more nuanced exposure at the cost of additional implementation and calibration. Kestrel Quant argues for the graded approach, but the article does not establish that it performs better generally.
What the ONEUSDT example reports
Kestrel Quant’s system log dated September 28, 2026 describes a ONEUSDT long with a score of 33.1 against a threshold of 30. The author reports an aggressive sell ratio of R=0.87 and falling open interest as adverse context. The log records a 0.7x position-size multiplier, a stop tightened by 20%, and a “quick in-and-out” approach.
Rank #2
These are author-reported details from one example, not independently audited trade data. The example illustrates how the author says the mechanism handled a marginal signal; it does not establish that the trade was profitable or that the settings suit other assets or strategies.
What is and is not established
Kestrel Quant also describes the risk allocator as event-driven middleware using precomputed lookup tables and claims processing takes less than 2 milliseconds. The reviewed account provides no independent latency measurement. It likewise claims improvements in Sharpe ratio and maximum drawdown, but supplies no comparative data, evaluation period, or independent validation. Those improvements should be treated as claims, not demonstrated outcomes.
The article does not provide a complete sizing equation, a calibration procedure, or evidence for a universal win rate, expected return, or risk reduction. The mechanism is a proposal and implementation account, not proof that dynamic sizing guarantees profits. The author warns that consecutive losses and cryptocurrency-market risks remain possible.
Independent reader supportYour contribution helps us test, update, and keep practical guides available for everyone.What a reader should verify before relying on the approach
- Define the rules: Establish the acceptance threshold, zone boundaries, score calculation, sizing decay, and stop adjustment before evaluating results. Kestrel Quant’s article does not supply all these specifications.
- Test comparable cases: Compare binary and graded execution on the same signals and evaluation period, with documented assumptions and costs. The published account does not include a controlled comparison.
- Review risk behavior: Examine losses, drawdowns, and consecutive losing trades, not only selected examples or headline performance measures.
- Separate implementation claims from trading evidence: A reported processing time describes the author’s system account; it does not establish strategy efficacy.
Cryptocurrency trading can result in substantial losses. Smaller positions and tighter stops may change exposure, but they do not remove market risk or ensure a favorable outcome.
Quick Recap
Best Value
Rank #4
Product prices and availability are accurate as of the date/time indicated and are subject to change. Any price and availability information displayed on Amazon at the time of purchase will apply.

