
The team in Sergey Shinder’s account nearly upgraded its database after a dashboard showed p99 “database time” near 900 milliseconds for thirteen weeks. But the database’s own statistics reportedly showed queries taking 3–5 milliseconds. The gap came down to what the tracing span measured: it included time waiting for a pooled connection, not just time spent executing a query. [DEV Community]
What happened in the thirteen-week investigation
Shinder says the dashboard’s peak p99 database-time line stayed around 900 milliseconds despite query tuning, adding two indexes and rewriting a join. The database statistics view, by contrast, reportedly showed the same statements taking 3–5 milliseconds, running millions of times without notable outliers. The instance was at 12% CPU during the busiest hour, according to the post. These are figures from one personal account, not independently verified measurements or general performance benchmarks. [DEV Community]



The apparent contradiction was in the instrumentation. The repository-method span began before the connection pool provided a connection and ended after rows were mapped. Its duration therefore covered several stages, not only the database statement.
Why “database time” was not just query time
A span label is not a guarantee about what its duration represents. Its start and end boundaries determine what work and waiting are included. In the account, the span bundled together connection acquisition, statement execution and row mapping. A long duration could therefore reflect a queue before the query reached the database.
#1 Best Overall
| Measurement | What it covers in this account | What it helps distinguish |
|---|---|---|
| Repository-method span labeled “database time” | Connection-pool wait, statement execution and row mapping | Total time through the repository method, but not which stage caused it |
| Connection-acquisition span | Waiting for a pooled connection | Whether requests are queued for connections |
| Statement-execution span | Executing the database statement | How long the statement itself takes, separate from pool wait |
The post’s practical lesson is to place instrumentation boundaries where the resource changes hands. Separate spans make it possible to tell whether time is spent waiting for an application-side connection or executing work in the database. [DEV Community]
How an HTTP call kept the connection busy
The account traces the pool queue to a despatch-note export endpoint. It opened a transaction and then called a PDF rendering service over HTTP while holding a database connection for up to eight seconds. Shinder reports that 40 exports per minute, against a pool of 20 connections per pod, were enough to make other queries look slow in the dashboard. Those figures describe this incident only; the post does not establish a general capacity rule. [DEV Community]
Rank #2
The key issue was not that the PDF service made a database statement slower. The transaction kept a scarce pooled connection occupied during network work. Other requests needing connections could wait, and the broad repository span counted that wait as “database time.”
How the team changed its instrumentation and endpoint
Shinder reports four changes: separating connection acquisition and statement execution into named spans, moving PDF rendering until after the export read and commit, adding an architecture test against an open transaction across an outbound HTTP call, and changing the alert to watch pool wait time. [DEV Community]
Together, those changes address different parts of the problem: the spans make the source of elapsed time visible; the transaction change avoids holding a connection during rendering; the architecture test guards against reintroducing that pattern; and the alert focuses on the queue the team wanted to detect.
How to tell whether latency is in the database or the pool
- Check the span boundaries. Find where the trace starts and ends. Determine whether the measured duration includes acquiring a connection, executing a statement, and mapping results.
- Break out the handoff. Record connection-acquisition wait separately from statement execution, using distinct spans or equivalent measurements.
- Compare like with like. Inspect statement timing and database activity alongside application-side pool wait. A broad application span and a database execution metric do not measure the same interval.
- Inspect long-lived transactions. Look for transactions that remain open while code performs network calls or other work that does not need the connection.
- Alert on the suspected bottleneck. If the concern is a pool queue, track pool wait rather than relying only on a span whose duration combines multiple stages.
These checks follow the failure mode described in Shinder’s post; they are diagnostic questions, not a claim that every high-latency database dashboard is caused by pool contention.
Rank #4
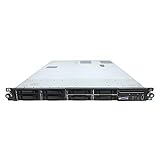
- HP ProLiant DL360 G7 8B Server
- 2x X5650 2.66GHz 12-Cores Total
- 32GB RAM / 8x 146GB 10K 2.5in SAS Hard Drives
- P410 w/ 512MB
What this account does—and does not—establish
Shinder’s post is one attributed engineering account. It does not name the database engine, tracing vendor, SDK or deployment configuration, and the retrieved page metadata shows “Sep 24” without a publication year. Its measurements should be read as the author’s reported incident, not as independently verified results or a benchmark for other systems. The closing line captures the instrumentation lesson: “A measurement that spans two systems gets attributed to the far one.” [DEV Community]
Quick Recap
Product prices and availability are accurate as of the date/time indicated and are subject to change. Any price and availability information displayed on Amazon at the time of purchase will apply.

