
iTechGuides is reader-supported. When you buy through links on our site, we may earn an affiliate commission. As an Amazon Associate I earn from qualifying purchases. Learn more
Zendesk and Salesforce Service Cloud both document reports and dashboards for tracking customer-service workload, speed, resolution, and customer feedback. Neither platform can be declared better at service outcomes from the available vendor documentation: the useful comparison is whether each can measure your KPIs with definitions, data, and access that fit your operation.
How the platforms organize service reporting
Zendesk reporting is organized around tickets and Explore datasets, with prebuilt Support dashboards and options to build custom reports. Salesforce Service Cloud reporting is organized around cases, with out-of-the-box support reports and prebuilt service dashboards. Those different data models matter: a ticket and a case may not represent identical work, and similarly named metrics may use different event rules.


Zendesk describes reporting for ticket status, category, backlog, first reply time, resolution time, reopened tickets, and customer satisfaction. Its metrics documentation covers separate datasets for tickets, updates history, backlog history, and SLA measures. Report creation and dataset availability depend on the plan and dataset. Zendesk’s metrics and attributes guide and dataset guide describe these reporting foundations.
What’s actually slowing this PC down?
Pick the symptom - the matching free tool is one click away.
Salesforce documents case reports, support activity reports, and dashboards for cases, rep and queue performance, and average handle time. The prebuilt Service reports and dashboards and Service Intelligence dashboards are documented capabilities, but access and availability can depend on edition, permissions, installation, or additional cost. Confirm the requirements in the specific Salesforce org before treating a dashboard as included.
#1 Best Overall
Compare the KPIs by what they count
Workload and backlog
Start with ticket or case volume, open work, and trends over a shared reporting period. Zendesk defines backlog as tickets currently in new, open, pending, or on-hold states. That is a snapshot based on specific statuses, not automatically equivalent to a Salesforce backlog figure. Compare only after agreeing on included states and whether the measure is a point-in-time count or a period-based trend. Zendesk’s guide to analyzing support metrics explains the platform’s backlog and related measures.
Response, closure, and handling speed
Keep first reply or wait time, first closure, final resolution, and handle time separate. Salesforce’s Service Intelligence Cases Dashboard lists time to first close and time to close; its time-to-close measure includes cases reopened and closed later, while time to first close records the first closure event. These are not interchangeable. When comparing them with Zendesk first reply or resolution measures, document the start and end events, treatment of pending or paused time, and whether reopened work changes the clock. Salesforce describes these case measures in its Service Intelligence Cases Dashboard documentation.
Rank #2

- PREPRINTED: These receipts are pre-printed with common salon services but also include a blank line for added flexibility. There is a space for operator's name as well as the amount due per service and a total amount due.
- PERFORATED: The pad is perforated on top allowing one for your records and other for check out at the register.
- BULK PACK: Each pad includes 100 sheets that are numbered in sequence for easy reference.
- CONVENIENT SIZE: The pad measures 5.25" tall and 3" wide making it easy to use and store.
Resolution quality
First-contact resolution and reopen rate can reveal whether work is actually resolved rather than merely closed quickly, but the numerator and denominator need explicit definitions. Salesforce defines first-time resolution as the percentage of cases closed with only one response, such as one email, voice call, or messaging session. Do not assume that definition matches a Zendesk one-touch measure or another team’s use of “first contact resolution.” Define what counts as a response, contact, and resolved case before comparing rates.
Customer feedback
Both platforms document customer satisfaction reporting, but a CSAT score is only comparable when the collection method and covered population match. Record the survey trigger, response rate, channel, case coverage, and whether survey results come from a built-in feature or an integration. Salesforce’s Cases Dashboard documentation includes CSAT from surveys and CSAT by channel; Zendesk’s support metrics guidance covers customer satisfaction reporting.
Operational context and custom fields
Break results down by channel, priority, queue, agent, category or reason, and SLA where those dimensions are available and consistently populated. Zendesk says custom ticket fields can be used in custom reports but are not included in prebuilt dashboards. That distinction matters if a KPI depends on organization-specific reasons or workflow fields: confirm the reporting path rather than assuming a dashboard exposes every field.
Build a like-for-like KPI scorecard
Before comparing the tools—or comparing teams across them—write down each metric’s rules. Use the same sample period, channel mix, severity or priority, and staffing context where possible.
Rank #4
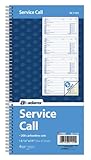
- Record all incoming calls needing service
- 2-part carbonless
- Spiral bound on left
- Part one is perforated to give to service person, part two remains in book for records
- White, canary paper sequence
- Choose the unit of work. Decide whether the measure counts tickets, cases, contacts, or another entity, and explain how duplicates, merged work, or follow-up interactions are handled.
- Define the events. State the exact start and end events for each speed metric, including whether first reply, first close, and final close are distinct.
- Set state and time rules. Specify which statuses count as backlog, whether pending or on-hold periods pause a clock, and how reopened work affects closure time.
- Write the formula. Record the numerator, denominator, exclusions, and reporting window for rates such as first-contact resolution, reopen rate, and CSAT.
- Check segment coverage. Verify channel, priority, queue, agent, and custom-field values are populated consistently enough to support breakdowns.
- Verify reporting access. Confirm the relevant Zendesk plan and dataset or Salesforce edition, permissions, installation, and any additional-cost requirements in the actual tenant.
- Run a controlled pilot. Compare the same representative cases or tickets and period, then reconcile samples where the dashboards disagree. A dashboard label alone is not proof that two systems count the same event.
Which platform fits your KPI needs?
Choose based on the measures and operating context you need, not an assumed service-quality winner. Zendesk’s reporting model may be a more direct fit when your workflows and analysis are ticket-centered and its available datasets and custom reports cover the required dimensions. Salesforce Service Cloud may fit when your service operation is case-centered and the documented case, queue, rep, and service dashboards align with your reporting needs. In either system, validate current access and configuration before committing to a scorecard.
Crashes, No Sound, or Screen Glitches?
Random freezes, missing sound and display glitches usually trace back to one bad driver. Find and replace yours safely.Free scan · under a minuteWindows Errors? Fix Them Before They Spread
Repair common Windows errors and clear accumulated junk for a smoother, more stable PC - no reinstall needed.Free scan · no reinstallThe cited product documentation describes capabilities and definitions, not an independent, like-for-like study of customer outcomes. It therefore does not establish that either platform produces faster resolutions, higher CSAT, or better service overall.
Quick Recap
Best Value
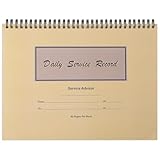
- Record Book: the package includes 1 daily service record book with 80 sheets, offering ample space to meet daily logging needs; It's a practical tool for tracking appointments, managing tasks, and enhancing customer service efficiency
- Ideal Size: measuring 8.5 x 11 inches, this activity log notepad balances portability and capacity; With 80 pages, it's ideal for daily use in the automotive industry, serving as a reliable service record management tool for consistent tracking
- Nice Quality: crafted from quality paper, the activity log book features reliable coil binding for easy page turning and tear-out; Its structured layout provides ample space for detailed entries, supporting effective schedule planning
- Friendly Design: designed for convenience, the daily log book's coil binding allows effortless sheet removal whenever needed; The intuitive layout ensures quick access to logging sections, making daily activity recording simple and efficient
- Versatile Usage: the service log book is a helper for the automotive industry or individuals to record scheduled maintenance, the shop can use it to register the maintenance needs of different customers, individuals can use it to keep track of flat rate hours
Product prices and availability are accurate as of the date/time indicated and are subject to change. Any price and availability information displayed on Amazon at the time of purchase will apply.

