
Quick wins for a faster PC:
Clear out junk files and repair common Windows errorsFree Scan →Scan for outdated or missing drivers - takes under a minuteDriver Scan →Repair Windows errors before they cause bigger problemsFix Now →iTechGuides is reader-supported. When you buy through links on our site, we may earn an affiliate commission. As an Amazon Associate I earn from qualifying purchases. Learn more
Just 8 of 89 major companies reviewed—about 9%—reported using biodiversity indicators in their sustainability reports, according to a Lund University release published in 2026. Only two of those eight reported using more than one. The finding describes reported use in the companies assessed, not a census of all businesses or proof that other companies do no biodiversity measurement internally.
What the study counted
The study, “Biodiversity at risk when businesses rely on narrow indicators,” appeared in the Journal of Cleaner Production on 18 August 2026. Its abstract describes a review of Global Fortune 500 businesses in high-impact sectors and reports that 9% of assessed businesses used biodiversity indicators as of 2025. The university’s account gives the concrete sample and count: researchers reviewed 89 major companies across food, beverages, tobacco, apparel, chemicals, construction, energy and mining; eight disclosed using indicators. The two descriptions are broadly consistent, but the available accounts do not spell out every sampling-frame or reporting-period detail. The 89 should not be read as the entire Fortune 500. Lund University’s account; the journal article.


That distinction matters: the result is about what researchers found reported in sustainability reports. It does not establish that companies that did not disclose an indicator never measure biodiversity internally.
Why one biodiversity indicator can miss important places
Biodiversity is not a single attribute that one number can fully represent. Indicators use different data and methods to represent different aspects of nature, and the study found that they often ranked locations differently. Spatial correlations between indicators were often weak and sometimes negative.
#1 Best Overall
For example, a company prioritizing places with high ecosystem integrity under Mean Species Abundance (MSA) could still overlook locations important to threatened species under STAR. The indicators are not useless or interchangeable: each can reveal information, but relying on one as a complete proxy can leave other biodiversity values out of a decision. The study’s abstract.
What the ecoregion analysis found
The researchers compared four indicators and examined where their aggregated values overlapped with projected habitat loss. Across 846 terrestrial ecoregions, 33 had more than half of the aggregated value for each assessed indicator concentrated in places projected to face high habitat loss by 2050. In 10 of those ecoregions, the share was at least 80%. Most of the affected regions were tropical; agricultural expansion and deforestation were identified as the primary projected drivers.
Rank #2

- Used Book in Good Condition
These are modeled projections, not observed outcomes or a claim that the projected loss has already occurred. The finding shows why a global aggregate alone can be insufficient: it can obscure where biodiversity values and future pressures coincide. Assessing at ecoregion level can help expose local or regional priorities that a global view may miss. The journal abstract.
Outdated Drivers Are Slowing You Down
One free scan finds every outdated or missing driver and matches the right update for your exact hardware.Free scan · exact hardware matchPC Slower Than It Used to Be?
A free scan shows the junk files, broken settings and background clutter dragging Windows down - then fixes them in one click.Free scan · Windows 10 & 11What companies can do with the findings
The study’s recommendations are guidance from its authors, not a binding reporting standard. They point toward preserving detail rather than collapsing biodiversity into a single score:
Rank #3
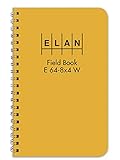
- Wire-o bound with high visibility yellow cover
- Wire-o 4 ⅞ x 7 ¼
- Ruled light blue with red vertical lines
- Six vertical columns left page and 8x4 to the inch right page
- Inside quality white ledger paper is special formulated for maximum archival service with material that is 50 percent cotton and water resistant
- Use multiple indicators to represent different aspects of biodiversity; where possible, use more than one indicator for an aspect to reduce dependence on a particular dataset or method.
- Treat composite indicators cautiously. They can help with initial screening, but use individual indicators for consequential decisions so important differences remain visible.
- Assess results at ecoregion level as well as globally, to avoid overlooking values in less species-rich ecosystems.
- Improve measures for underrepresented dimensions, including genetic diversity and ecological connectivity.
- Broaden taxonomic coverage, particularly for plants, fungi and invertebrates.
- Pair indicators with assessments of future human pressures, such as projected land-use change.
The authors’ synthesis is that composites integrating multiple indicators can reduce the risk of overlooking biodiversity values, while applying multiple individual indicators in parallel is the most robust way to retain information about each aspect. Reporting more indicators is not, by itself, evidence that a company has reduced harm; it can make decisions better informed, but outcomes depend on what the company does with the information. Lund University’s recommendations; the article abstract.
Quick Recap
Rank #4
Product prices and availability are accurate as of the date/time indicated and are subject to change. Any price and availability information displayed on Amazon at the time of purchase will apply.

