
Do these 3 things before closing this tab:
1Clear out junk files and repair common Windows errors2Fix the driver behind crashes, sound loss and screen glitches3Repair Windows errors before they cause bigger problemsiTechGuides is reader-supported. When you buy through links on our site, we may earn an affiliate commission. As an Amazon Associate I earn from qualifying purchases. Learn more
To monitor failures in a Node.js SaaS, instrument the service with OpenTelemetry, attach stable service and deployment identity, export metrics to a backend such as Prometheus, define alert rules for meaningful failure conditions, and route notifications through Alertmanager to email. The metric names and thresholds should reflect your application’s failure modes and service objectives—not a universal template.
How the monitoring pipeline fits together
A practical open-source path is:
- Instrument: collect request and dependency telemetry from the Node.js service.
- Identify: associate that telemetry with the service, version, environment, and relevant deployment context.
- Export: send metrics to Prometheus or another compatible backend.
- Visualize: build dashboards that show failure patterns in context.
- Alert: evaluate rules for conditions that require action, then use Alertmanager to deliver grouped email notifications.
OpenTelemetry’s JavaScript documentation lists traces and metrics as Stable and logs as Development; its Node.js support targets active or maintenance LTS versions. These are the statuses in OpenTelemetry’s documentation as of October 2026 and may change. OpenTelemetry JavaScript documentation
| # | Preview | Product | Price | |
|---|---|---|---|---|
| 1 |

|
GL.iNet GL-MT5000 Brume 3 Wired VPN Security Gateway NO Wi-Fi | $129.99 | Buy on Amazon |
| 2 |

|
SonicWall TZ280 2.5 Gbps Next-Gen Firewall Appliance, HW Only | $436.00 | Buy on Amazon |
| 3 |

|
HPE R1Q04A Aruba Central Ready AirWave 8 Appliance | $15,000.00 | Buy on Amazon |
| 4 |
|
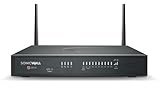
SonicWall TZ280W 2.5 Gbps Next-Gen Firewall Appliance, HW Only | $588.00 | Buy on Amazon |
Instrument the Node.js service
Configure the OpenTelemetry Node.js SDK before loading application modules that need instrumentation. For supported libraries, use an OpenTelemetry integration or instrumentation package. The official guidance documents HTTP and Express instrumentation as examples. Its Node auto-instrumentation metapackage can simplify broad coverage, while selected individual packages keep the dependency scope narrower when you already know what needs instrumentation. OpenTelemetry JavaScript documentation
What’s actually slowing this PC down?
Pick the symptom - the matching free tool is one click away.
For failure monitoring, choose signals that distinguish unsuccessful requests from expected client errors and help identify the affected route or dependency. OpenTelemetry provides instrumentation mechanisms; it does not define a universal SaaS failure taxonomy or prescribe one set of failure thresholds. Decide what counts as a failure for your application before writing dashboard queries or alert rules.
#1 Best Overall
- 【Up to 1100 Mbps VPN Speed 】 Hardware-accelerated WireGuard and OpenVPN-DCO deliver up to 1100 Mbps VPN throughput, over 3× faster than Brume 2 for smooth remote access and file transfers.
- 【Three 2.5G Ports & Multi-WAN】Tri-port 2.5GbE design with flexible WAN LAN configuration supports multi-gigabit wired setups, dual-ISP Multi-WAN and failover to keep home and SOHO networks online.
- 【Stealth VPN Obfuscation】VPN obfuscation disguises VPN traffic as regular HTTPS, helping you evade blocking, bypass restrictive networks and maintain stable, private connections.
- 【DPI protection】Deep Packet Inspection with visual dashboards blocks adult/gambling/malicious sites, while SQM and QoS prioritize gaming, calls, and video when bandwidth is tight
- 【OpenWrt & USB 3.0 Expansion】OpenWrt with 1GB DDR4 and 8GB eMMC lets you install plugins and build VPN, ad-blocking or NAS, while USB 3.0 Type‑C connects high-speed storage or 4G/5G dongles
Add service and deployment identity
Telemetry is more useful when an alert can identify which service instance and release produced it. Set service identity, including service name and version, and add appropriate environment or deployment context such as host, container, or deployment attributes. OpenTelemetry resources describe the entity producing telemetry; those attributes can help narrow a system-level signal to a host, pod, or deployment. Resource values can be configured in code or through OTEL_RESOURCE_ATTRIBUTES. OpenTelemetry resources
Use bounded, operationally meaningful metric dimensions such as service, environment, and version. Avoid per-user or per-request identifiers as metric labels: values with unbounded variety can make metrics harder and more expensive to operate.
Export metrics and build dashboards
A dashboard needs a metrics backend receiving the service’s telemetry. For Prometheus, OpenTelemetry documents an exporter that exposes a metrics endpoint for scraping, as well as Prometheus OTLP ingestion options. The documentation recommends using the OpenTelemetry Collector in production environments. Choose the ingestion path that fits your deployment and backend, and secure the metrics endpoint so only the intended collector or scraper can reach it. OpenTelemetry JavaScript exporters
Rank #2
- APPLIANCE ONLY: Hardware unit sold without a service subscription — security services, firmware updates and support are NOT included and must be purchased separately to activate protection.
- PERFORMANCE: Up to 2.5 Gbps firewall inspection, 1 Gbps threat prevention and 1.2 Gbps IPSec VPN throughput driven by SonicWall's patented Reassembly-Free Deep Packet Inspection (RFDPI) engine.
- CONNECTIVITY: 8x1GbE + 2x1G SFP in a desktop form factor; zero-touch deploy and manage on-box or via cloud Network Security Manager (NSM).
- THREAT PROTECTION: SonicOS 8 delivers intrusion prevention, gateway anti-malware, application control, TLS/SSL decryption, Capture ATP multi-engine sandboxing (RTDMI) and reputation-based content & DNS filtering with an active service subscription.
- BUILT FOR SMALL BUSINESS & BRANCH: Secure SD-WAN, IPSec and SSL VPN plus Zero-Trust Network Access through Cloud Secure Edge keep distributed sites and remote workers protected.
Design dashboards to answer operational questions rather than merely display every available metric:
- Are failures rising, and has request volume changed at the same time?
- Which service, version, or environment is affected?
- Is the impact broad, or concentrated in a route or dependency?
- Did the pattern begin around a deployment or a change in traffic?
There is no canonical SaaS failure dashboard or universal metric list established by the OpenTelemetry documentation. Select measures and breakdowns that match your instrumentation and service objectives.
Write alert rules for actionable conditions
Prometheus alerting rules evaluate expressions over time series. Give each rule useful labels and annotations, including a concise description of the symptom and a pointer to the relevant dashboard or runbook. Choose the expression and threshold from your service’s failure modes and objectives; do not copy a threshold without checking what it means for your traffic and users.
Rank #3
- Aruba Central Ready AirWave 8 Appliance
- Aruba Central Ready AirWave 8 Appliance
- Aruba Central Ready AirWave 8 Appliance
A rule’s optional for duration keeps it pending until the condition remains active for the specified period. Prometheus also documents keep_firing_for, which can help reduce flapping or false resolutions in some cases. Prometheus alerting rules
- Use a sustained condition when short-lived blips should not trigger email.
- Separate severity levels according to the response required, not just the size of a number.
- Consider whether absent telemetry should trigger its own alert; a quiet dashboard can mean either healthy service or missing data.
Route alerts to email with Alertmanager
Prometheus evaluates alert conditions; Alertmanager handles notification operations such as grouping, rate limiting, silencing, and dependencies. As the Prometheus project puts it, “Prometheus’s alerting rules are good at figuring what is broken right now, but they are not a fully-fledged notification solution.” Use Alertmanager when you need those notification controls rather than treating each firing rule as an independent email. Prometheus Alertmanager
An email receiver needs deployment-specific SMTP configuration, including a recipient and SMTP host, plus any required authentication and TLS settings. Protect SMTP credentials as secrets. Decide explicitly whether resolved alerts should also send email through the receiver’s send_resolved setting; it is useful when recipients need closure, but can add mail for conditions that recover quickly. Alertmanager configuration
Rank #4
- APPLIANCE ONLY: Hardware unit sold without a service subscription — security services, firmware updates and support are NOT included and must be purchased separately to activate protection.
- PERFORMANCE: Up to 2.5 Gbps firewall inspection, 1 Gbps threat prevention and 1.2 Gbps IPSec VPN throughput driven by SonicWall's patented Reassembly-Free Deep Packet Inspection (RFDPI) engine.
- CONNECTIVITY: 8x1GbE + 2x1G SFP + 802.11ax Wi-Fi in a desktop form factor; integrated 802.11ax (Wi-Fi 6) wireless; zero-touch deploy and manage on-box or via cloud Network Security Manager (NSM).
- THREAT PROTECTION: SonicOS 8 delivers intrusion prevention, gateway anti-malware, application control, TLS/SSL decryption, Capture ATP multi-engine sandboxing (RTDMI) and reputation-based content & DNS filtering with an active service subscription.
- BUILT FOR SMALL BUSINESS & BRANCH: Secure SD-WAN, IPSec and SSL VPN plus Zero-Trust Network Access through Cloud Secure Edge keep distributed sites and remote workers protected.
Group related alerts to reduce mail floods, and make the notification useful at a glance: identify the affected service and environment, state the symptom and severity, and link to the right dashboard or runbook. Validate delivery in the target deployment; SMTP hostnames and authentication requirements depend on the mail service you use.
Choose the right implementation options
| Decision | Option | When it fits |
|---|---|---|
| Instrumentation scope | Selected instrumentation libraries | Use when the libraries and signals you need are known and you want to limit additional dependencies. |
| Instrumentation scope | Node auto-instrumentation bundle | Use when broad supported-library coverage is convenient and its additional dependency footprint is acceptable. |
| Metrics ingestion | Prometheus scraping of an exporter endpoint | Use when Prometheus can scrape a reachable, secured endpoint. |
| Metrics ingestion | OTLP ingestion | Use when your Prometheus-compatible backend or Collector-based pipeline is configured to receive OTLP. |
| Notifications | Alert rules without Alertmanager | Suitable only when the notification workflow does not need Alertmanager’s grouping, rate limiting, silencing, or dependency handling. |
| Notifications | Alertmanager plus email receiver | Use when email routing and notification controls are part of the operational workflow. |
The appropriate route depends on how your service is deployed and which backend you operate; consult the OpenTelemetry exporter guidance and the Alertmanager configuration reference for the supported configuration details.
The Tool Desk
Outbyte PC Repair FREERepair Windows errors before they cause bigger problemsFix Now →Outbyte Driver Updater FREEFix the driver behind crashes, sound loss and screen glitchesFind Drivers →Quick Recap
Product prices and availability are accurate as of the date/time indicated and are subject to change. Any price and availability information displayed on Amazon at the time of purchase will apply.

