
What’s actually slowing this PC down?
Pick the symptom - the matching free tool is one click away.
iTechGuides is reader-supported. When you buy through links on our site, we may earn an affiliate commission. As an Amazon Associate I earn from qualifying purchases. Learn more
A healthy-looking server or Docker daemon does not prove that a particular container—or the application inside it—is working. In my homelab, a container stayed dead for 64 days without the monitoring I had in place catching it. That is my experience, not evidence that any particular monitoring product always misses container failures. The underlying issue is scope: host metrics, container state, health checks, and application probes answer different questions.
Why can my server look healthy when my app is down?
Monitoring only sees the signals it is configured to collect. A host dashboard can show that a machine is reachable and has available resources while an application container is stopped. A Docker daemon metrics scrape can report on Docker without verifying that a user-facing service returns a useful response.
Docker’s documentation for collecting Docker metrics with Prometheus says: “Currently, you can only monitor Docker itself. You can’t currently monitor your application using the Docker target.” In other words, a green Docker target is not an application availability check.
Five monitoring layers, five different questions
- Host and daemon monitoring: Is the machine or Docker daemon available, and what resource activity is it reporting?
- Container state: Is the expected container running, stopped, restarting, paused, or dead?
- Container health: Does a configured command running inside the container pass?
- Application availability: Can a client reach the service over the path users depend on and receive a meaningful response?
- Alerting and recovery: Does a failure notify someone, trigger an appropriate recovery action, or both?
These checks complement one another; none should be treated as a substitute for all the others.
#1 Best Overall

- ⚡ EASY INSTALLATION: Installs in circuit panel of most homes with clamp-on sensors. Supports single-phase up to 240VAC line-neutral; single, split-phase 120/240VAC; and three-phase up to 415Y/240VAC (no Delta). The branch lines can automatically match different phases and have no restrictions in terms of quantity and voltage.Panels with access only to busbars will need flexible sensors available from SEM-Meter.
- ⚡ ENERGY MONITORING ANYTIME, ANYWHERE: Monitor your home's real power anywhere, anytime to prevent costly repairs, conserve energy, and save costs. Monitor solar / net metering. Light commercial 3 phase option available as a separate bundle. Protected by a 1-year warranty.
- ⚡ VARIOUS ELECTRICAL APPLIANCE MONITORING: Comes with 16 50A sensors to accurately monitor your air conditioner, furnace, water heater, washer, dryer, range, etc.
- ⚡ LOWER YOUR ELECTRIC BILL: SEM-Meter measures real-time spending and gets actionable notifications to understand where savings can be made, both to lower your electric bill and to conserve energy and protect the planet’s resources. Be an environmentalist.
- ⚡ REAL-TIME ENERGY DATA: Connect SEM-Meter device via 2.4GHz WiFi to monitor energy usage, with an accuracy range of 1%. View usage in real time through Android/Apple software. Statistics of power usage in now/day/week/month/year format: the validity period of hourly exported data is 90 days, and the exported data of day/month/year data is permanent, available at any time Export from application.
Why does Docker say my container is stopped?
By default, docker ps lists running containers, not every container Docker knows about. To include stopped containers, run:
docker ps -aDocker documents container states including exited and dead. An exited container has stopped; Docker describes a dead container as defunct and says it cannot be restarted. Check the state rather than assuming that a container missing from the default listing never existed or that every stopped container can simply be started.
Rank #2

- 2 Years of Cellular Service Included – Necto offers the most affordable cellular-enabled sensor with 2 full years of 4G LTE service included—no hidden fees, contracts, or WiFi required. With a built-in multi-network SIM card, you can remotely monitor conditions 24/7 and receive real-time alerts. After 2 years, you can renew the subscription from the app for only $6.99 a month.
- Instant Alert & 24/7 Monitoring - Keep tabs on your Home, RV, Car, or Pets from anywhere with the 3-in-1 temperature, humidity & power outage monitor. Customize the high and low temp/humidity thresholds and add up to 5 contacts for unlimited text and email alerts. Receive real-time alerts if critical changes in temp/humidity or a power loss occurs.
- Rechargeable Internal Battery - The Necto smart RV and pet monitor has a 3 day long-lasting rechargeable battery. Unlike WiFi sensors, Necto provides continuous monitoring in the event of a power outage, via its built-in battery and cellular technology. Receive instant alerts on your phone when battery power is low or if the device disconnects from the network.
- Intuitive Mobile App & Easy Setup - Our user-friendly mobile app gives you remote access to your sensor from anywhere. Use your smartphone or PC to customize alert thresholds, view past readings, and manage device settings with ease. The sensor takes minutes to install and requires no technical expertise. Simply activate the device through the app and plug it into any standard wall outlet.
- Fast Refresh & Free Data Storage - The industrial built-in temperature and humidity sensor takes readings every 10 seconds to make sure the temp/humidity are within the safe range. Every 10 minutes the most recent reading is updated on the online portal. Readings are stored on our servers for 1 year and can be downloaded anytime on a CSV file.
For a stopped container that is not dead, docker start CONTAINER starts it. This is a one-time manual action, not ongoing monitoring: it does not tell you when the container stopped or alert you if it stops again.
How do I know if my Docker container is unhealthy?
Docker health checks run a configured command and report a health status. The command, interval, timeout, retry count, and start period determine what is tested and when. A check is only as useful as its test: confirming that a process exists, for example, may not show that the application can serve requests or complete useful work.
Rank #3

- No WiFi? No Problem – 4G Cellular Connectivity: Wi-Fi down at your vacation home? Traveling off-grid in your RV? No complicated setup required. Includes a pre-installed global SIM with 2 years of cellular service. Supports 4G network monitoring in areas where Wi-Fi may be unavailable, suitable for vacation homes, cabins, crawlspaces, basements, warehouses, and RVs with cellular coverage. After the 2-year period, service can be renewed for just $29.99 per year.
- Real-Time Display & Fast Reporting: Screen refreshes every 5 seconds in constant-on mode; auto-sleep conserves battery and wakes instantly with a button press. The latest readings are automatically uploaded to the app every 10 or 30 minutes.
- Optional Wi-Fi Connection: Prefer Wi-Fi at home to save cellular data? Connect to 2.4GHz or 5GHz Wi-Fi networks by long-pressing the power button for flexible use at home or indoors. Dual connectivity gives you the freedom to choose what works best—4G or Wi-Fi, anytime.
- Multi-channel Alerts: Stay protected with instant alerts via app push, email, and on-device voice alarms for temperature or humidity changes, power failures, pipe freeze risks, disconnections, or even drops.
- App Control & Data Storage: Monitor temperature and humidity in real time with our intuitive app. Easily set alert thresholds and share access with family or team members—anytime, anywhere. All records are securely stored for up to 2 years and can be downloaded in CSV format for easy tracking and analysis.
Docker’s HEALTHCHECK reference describes the configuration, and its container run documentation explains health-check behavior. Choose a test that exercises the behavior you actually care about, and distinguish its result from a probe made by an external client. A check inside the container may pass even if users cannot reach the service through the relevant network path.
How should I diagnose a container that may have gone down?
- List all containers: Run
docker ps -aso stopped containers are included. Identify the expected container and note its reported state. - Check whether it should be running: Compare the state with the workload’s intended schedule and role. A stopped one-shot job, for example, may be expected; an always-on service generally is not.
- Inspect health-check configuration and logs: Confirm that the health command tests a meaningful behavior, then review recent container logs for clues. A passing health command does not establish external reachability.
- Test the service from the relevant network path: Make a request the way a dependent service or user would. Check for a meaningful application response, not merely an open host or daemon.
- Decide on notification and recovery separately: Set up a state or availability alert that reaches someone, and decide whether an automatic restart is appropriate for this workload.
This sequence is an inspection procedure, not a durable incident record or an alerting system. A single manual check tells you what you see now; ongoing detection requires configured checks and notification.
Rank #4

- EM16P MODEL & LOCAL CONTROL & DATA PRIVACY: Access your home energy monitor data locally via Built-in Web UI, Open API, and MQTT without relying on cloud services. Unlike cloud-dependent monitors, Refoss ensures your data stays within your home network. Direct local access protects your privacy while giving you 100% full control of your home energy system.
- NATIVE HOME ASSISTANT & OPENCLAW AI: Experience seamless Native Home Assistant integration right out of the box—no firmware flashing or complex coding required. Featuring ✨NEW✨ OpenClaw Support, it enables AI-driven automation for smarter, real-time energy management and seamless smart home control.
- MAXIMIZE SOLAR & ZERO FEED-IN AUTOMATION: Designed for solar homes, the power monitor works with the Refoss app and Home Assistant to automatically use surplus solar power. Appliances like EV chargers, washing machines, and water heaters are powered during midday peaks, maximizing solar self-consumption and reducing low-value electricity feed-in to the grid. Optimizes usage and reduces bills.
- REAL-TIME MONITORING & ±1% ACCURACY: Monitor voltage, current, active power, and power factor of major appliances. Provides ±1% accuracy (200A: 2–200A; 60A: 1–60A) and ±2% at low current. Daily data stored up to 5 years and exportable. With no subscriptions or hidden fees, you get deep historical insights to help you identify every energy-saving opportunity and save 10–20% on monthly bills.
- SMART ALERTS & CIRCUIT-LEVEL CONTROL: Set usage targets for each individual circuit and receive instant alerts when appliances exceed normal consumption. Refoss app supports automation and peak management to optimize schedules, reduce peaks, and improve efficiency. Real-time electricity usage monitor for circuit-level insights.
Can Docker events or Prometheus discovery catch a missing container?
Docker emits lifecycle events such as start, stop, die, and health_status. The Docker events reference says that only the last 256 log events are returned. Events can help explain recent changes, but the event stream alone should not be treated as a complete, durable history—especially when trying to understand an outage over a long period.
Prometheus can use Docker service discovery to find scrape targets with configurable refresh behavior. Discovery helps keep a target configuration aligned with changing containers; it does not, by itself, define a meaningful application check or guarantee an alert when a target disappears. Those outcomes depend on the scrape target, alert rules, and notification configuration you set up.
Best Value
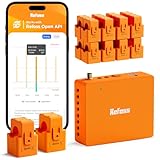
- AUDIT EVERY CENT & SLASH ELECTRIC BILLS: Stop the guesswork and start saving. By monitoring 18 individual circuits with professional ±1% precision, Refoss Home Energy Monitor shows exactly where your money goes. Identifying “energy vampires”—from HVACs to aging appliances—in real-time helps households effectively reduce monthly utility bills by 10%-20%. This smart power meter is the ultimate tool for electricity consumption audits.
- LOCAL PRIVACY & MULTI-PLATFORM CONTROL: Your home energy data belongs to you, not a cloud server. Featuring a built-in Local Web UI, Open API, and MQTT, and WebSocket, Refoss ensures 100% data privacy. Seamlessly integrate with Home Assistant (via Refoss_RPC) to manage every kWh without cloud reliance or subscription fees. Ideal for a secure electricity monitor with professional local control.
- SMART AUTOMATION & SOLAR ROI OPTIMIZATION: Turn your solar panels into a high-yield investment. Surplus solar and net metering energy can be directed to medium-power appliances like heat pumps, dishwashers, and microwaves, while time-of-use and peak demand energy management ensures maximum solar self-consumption, prevents low-value grid feed-in, and reduces utility bills.
- 5-YEAR DATA ANALYTICS & SMART FAULT ALERTS: Catch appliance failures early before they become expensive repairs. Refoss records minute/hourly/daily/weekly/monthly/yearly usage, with daily data securely stored for 5 years and fully exportable via CSV without any subscription. Receive smart alerts if a fridge or washer consumes unusually high energy, helping you optimize home power usage habits and prevent bill spikes.
- STABLE SIGNAL & EASY SETUP: This system supports Single-phase, Split-phase, and 3-phase 4-wire Wye systems, featuring 2 main sensors (up to 200A) and 16 branch sensors (up to 60A). ETL certified with a 2-year warranty, it includes an external high-gain antenna for enhanced Wi-Fi stability. Most importantly: if a sensor is installed backward, simply flip the reading in the App with one tap—no need to rewire or reopen the live breaker box.
Prometheus’s own health endpoint and readiness endpoint answer questions about Prometheus itself. A healthy or ready monitoring server does not prove that each monitored application container is healthy.
Will Docker restart a container if it stops?
Docker restart policies can restart containers after some exits, but they are recovery behavior—not a health verdict, notification, or record of how long a service was unavailable. The outcome depends on the policy and how the container stopped. Docker’s automatic-start documentation notes that manually stopped containers are not restarted by the policy until the daemon or container is manually restarted, and that the policy takes effect only after successful startup conditions.
Use a restart policy only when restarting is an appropriate response for the workload. Pair it with an alert that reports the underlying failure or unavailability; a successful restart can otherwise hide repeated interruptions from an operator.
Free tools Windows power users keep installed
One-click scans. No signup required.
How to choose checks that cover the failure you care about
Before trusting a dashboard or alert, identify what it actually observes and what happens when the expected signal vanishes. Check the specific configuration rather than relying on a tool’s name or a green status indicator.
- Scope: Does the check cover the host, Docker daemon, container state, in-container health, or application behavior?
- Signal: Is it a metrics scrape, Docker state inspection, health command, lifecycle event, or real application request?
- Missing-target behavior: Does a vanished container produce an alert, or does its metric or target simply disappear from a dashboard?
- History: Is there enough retained information to understand when the failure began and what happened? Docker’s event-return limit is one reason not to rely on that stream alone for a long incident history.
- Response: Does the setup show a dashboard, send a notification, restart a container, or combine these actions?
- Configuration: Are discovery, labels, network access, checks, alert rules, and notification routes all set up for the workload?
Docker’s daemon metrics, Docker state and events, health checks, and application-level probes can each add useful visibility. The reliable design is the one that checks the failure mode that matters to you and turns a failed or missing signal into an appropriate response.
Quick Recap
Product prices and availability are accurate as of the date/time indicated and are subject to change. Any price and availability information displayed on Amazon at the time of purchase will apply.

