
Windows Errors? Fix Them Before They Spread
Repair common Windows errors and clear accumulated junk for a smoother, more stable PC - no reinstall needed.Free scan · no reinstallCrashes, No Sound, or Screen Glitches?
Random freezes, missing sound and display glitches usually trace back to one bad driver. Find and replace yours safely.Free scan · under a minuteiTechGuides is reader-supported. When you buy through links on our site, we may earn an affiliate commission. As an Amazon Associate I earn from qualifying purchases. Learn more
Windows Performance Monitor (PerfMon) can help you spot whether a slowdown coincides with CPU, memory, or disk pressure—and which process may be involved. Open it by searching Windows for Performance Monitor or pressing Win+R, typing perfmon, and pressing Enter. Treat its counters as clues to investigate, not proof that a component is defective.
Choose a capture that can catch the slowdown
Before opening a graph, note what you were doing, when the PC became slow, how long it lasted, and whether you can reproduce it. A live graph is useful for a slowdown you can trigger; an intermittent event may require a longer-running log that spans the time it usually occurs.
Start with a few counters related to the symptom. A focused graph makes it easier to see whether system-level pressure coincides with activity from a particular process. Adding every available counter at once can make the result harder to interpret.
Open PerfMon and watch a live slowdown
- Open Performance Monitor. Search Windows for Performance Monitor, or press Win+R, enter
perfmon, and press Enter. Microsoft describesperfmon.exeas opening the MMC snap-in, which includes the Performance Monitor graph, Data Collector Sets, and Reports. See Microsoft’s perfmon command reference. - Select the live Performance Monitor view. If you can reproduce the issue, keep the graph open and note the time and activity when the slowdown occurs.
- Add a small group of relevant counters. Begin with processor activity, available and committed memory, disk read/write latency, and process activity. Select the appropriate instance when a counter offers multiple processors, drives, or processes.
- Compare the slowdown with the graph. Look for sustained pressure that overlaps the symptom and process activity that may explain it. A brief peak alone is not enough to identify a bottleneck.
Capture an intermittent problem in a log
If the slowdown is gone by the time you open the live graph, use a Data Collector Set to collect counters across a longer window. In PerfMon, expand Data Collector Sets to create or start a set, then review collected data under Reports or in Performance Monitor. Microsoft also documents Logman for creating, starting, and stopping counter collection from an elevated command prompt; see the Logman command reference.
#1 Best Overall

- Model: Dell OptiPlex 3070 Small Form Desktop PC
- Processor: Intel Core i5-9500 64-bit 6-Cores Processor, 3.0 GHz Base Speed up to 4.40 GHz Boost Speed, 9MB Intel Smart Cache
- Specifications: 16GB DDR4 Memory, High speed 512GB SSD, Intel UHD Graphics 630
- Features: Compact Form, Windows 11 Pro (64-bit), Wireless Keyboard and Mouse included
- Ports: DisplayPorts, USB 3.1 Gen 1, USB 2.0, Audio Ports, Gigabit Ethernet.
Choose a sampling interval and duration that fit the symptom rather than assuming one interval works for every case. Microsoft’s Windows Server scenario example uses a 15-second interval and a circular binary log; it is an example, not a universal recommendation. Allow enough disk space for the capture, and remember that a manually configured collector may need to be restarted after a PC restart.
Check whether the graph is compressing a dense log. Microsoft states, “A maximum of 1,000 data points can be displayed within a graph.” In its Windows Server troubleshooting guidance, Microsoft explains that high-density data can be summarized or combined in the display. Do not rely on a smoothed line alone when the timing or detail of individual samples matters. See Microsoft’s Windows Server performance troubleshooting guide.
Rank #2

- Fast Performace - This Desktop PC is engineered to deliver lightning-fast performance with an i7-6700 3.2GHz processor that ensures quick boot times and speedy application launch. Dell computers are professionally renewed to deliver like-new performance.
- AX200 WIFI 6 Built-in WIFI Card Installed - The Data Transfer Rate of this WIFI Card reach 3000 Megabytes Per Second. With WIFI 6 technology, you'll get faster speeds, improved security,so you can easily connect to the internet and other devices in your home or office on the dell desktop.
- Easy to Setup - This Desktop Computer is designed for easy setup, so you can start working out of box. The system comes pre-installed with Windows 11 Pro, and the included 24-inch Koorui monitor can be set up easily without any complicated steps.
- High-Speed 32GB DDR4 Ram & 512gb M.2 NVMe SSD - The Desktop Computer set features 32GB DDR4 RAM and a 512GB M.2 NVMe SSD,providing plenty of high-speed memory and storage space to ensure that even the most resource-intensive applications run smoothly.
- New 24 inch FHD Monitor - Refurbished Desktop Computers include a new Koorui 24 inch FHD monitor. Which features a Full HD resolution of 1920 x 1080, providing clear and sharp images.The monitor has a slim design and a narrow bezel, making it an attractive addition to your workspace on this dell refurbished desktop.
Read CPU counters as evidence of workload
Start with total processor time and compare it with user time, privileged time, and process activity. User time can reflect application work; privileged time reflects work in the operating system or kernel. Sustained high use during the slowdown is more informative than a momentary rise.
Free tools Windows power users keep installed
One-click scans. No signup required.
If interrupt or deferred procedure call activity is notable, it can point toward a driver or hardware-related investigation, but it does not prove which driver or component is responsible. Microsoft’s server troubleshooting material also discusses processor queue length, context switches, and process thread and handle counts as possible diagnostic counters. Add them only when the initial capture suggests CPU pressure that needs further explanation.
Rank #3

- 15.6" FHD Portable Monitor - Featuring a 1920*1080P resolution, 178°FULL viewing angle, HDR, and Low Blue Light Super Clear IPS A-grade screen, this Anyuse portable screen for laptop enhanced visual experience, reduces eye strain and fatigue.
- Double Type-C Port -For Plug & Play - Anyuse portable monitor features 2 full-featured Type-C ports and 1 MINI HDMI port. You can easily access your favorite devices with just one USB Type-C or MINI HDMI cable. NOTE: Your device should support Thunderbolt 3.0/4.0 or USB 3.1 Type C DP ALT-MODE.
- Portable & Light Weight - At just 1.37lbs and 0.04 inch thin, this portable laptop monitor is ultra-portable and perfect for on-the-go productivity or gaming. flexible to use anywhere you need a second screen for laptop. bringing you efficiency for meetings, work from home, and presentations.
- Able to Balance Work and Play - With multiple display modes [copy mode/extension mode/second screen mode]. During meetings,it can copy your laptop's content as a second screen to share with others.At work, it can be used as a second extended screen to increase productivity. In life, adjusting to HDR mode can upgrade the image to a new level, providing you with brighter highlights, more realistic colors and images.Two built-in speakers provide an amazing viewing and gaming experience.
- Wide Compatibility - Enjoy hassle-free plug-and-play functionality with the portable monitor. it is compatible with all devices equipped with HDMI and USB Type-C ports like laptops, PS, XBOX, SWITCH game consoles, No app or driver installation required.
Interpret memory counters together
MemoryAvailable MBytes reports immediately available physical memory. Memory% Committed Bytes In Use shows committed virtual memory as a percentage of its limit. These measure different things: a high commit percentage alone does not establish that physical RAM is the bottleneck.
Compare their trends during the slowdown with process working sets to see which processes are using RAM. If paging may be involved, collect paging-related counters and check whether that activity is sustained during the symptom. Do not infer that more RAM is needed solely because committed memory exceeds installed physical memory.
Rank #4

- i5 CPU + 16GB RAM: High-Performance Multitasking - Featuring i5 CPU processor (3.3GHz) and 16GB dual-channel RAM, this all in one desktop handles heavy multitasking, complex document processing, and light creative work effortlessly. Ideal for professionals, content creators, and power users seeking robust performance
- 256GB SSD: Ample Storage & Fast Speed - Equipped with 256GB high-speed SSD, the desktop boots quickly and loads large files/apps in seconds. Spacious enough for multiple projects, media files, and professional software, balancing speed and storage capacity for mid-to-high productivity needs
- 24" Monitor + Privacy Protection Webcam: Professional Visuals & Video Calls --- The 24" high-def display delivers sharp details and true colors, suitable for design work, data analysis, and long work sessions. The Privacy Protection webcam ensures crystal-clear video conferences, perfect for remote professional collaboration or online
- WiFi 6 + BT 5.3: Seamless Wireless Experience - Built-in WiFi 6 offers ultra-stable, high-speed internet for cloud work, online collaboration, and large file transfers. BT 5.3 pairs reliably with wireless peripherals (design tablets, headsets, printers); creating a flexible ; cable-free workspace
- Plug & Play + Premium Black Design - Preloaded with Win11 and all necessary drivers, this prebuilt all in one pc is ready to use out of the box. The premium black integrated design exudes professionalism; fitting perfectly in home offices; studios ; or small businesses—combining performance with elegant aesthetics
Correlate disk latency with process I/O
Look at average disk seconds per read and write, then compare any rise with process read/write operations and the time the slowdown occurred. High disk activity by itself does not show whether a busy workload, one process, or a storage problem is behind the symptom.
Microsoft’s Windows Server troubleshooting guide gives example disk-latency bands of under 15 ms as healthy, over 25 ms as a warning, and over 50 ms as critical. These are Microsoft-published Windows Server indicators, not universal thresholds for every consumer PC, workload, or disk type. The guide also notes that brief spikes can be tolerated and recommends investigating longer periods of elevated latency.
Best Value
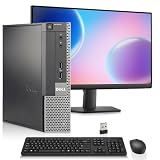
- Intel Processor: Powered by an Intel Core i5 4th Generation processor with 6MB Intel Smart Cache, delivering smooth performance for work, web browsing, and everyday multitasking.
- Memory & SSD Storage: This desktop computer features 8GB RAM and 256GB SSD for fast boot times, smooth performance, and quick access to your files and applications.
- Complete Computer Bundle: Includes 19-inch monitor, USB Wi-Fi adapter, wireless keyboard and mouse, making this desktop computer ready to use right out of the box.
- Windows 11 Pro & Intel Graphics: Pre-installed with Windows 11 Pro and powered by Intel HD Graphics 4600, this PC is ideal for office tasks, streaming, and everyday computing.
- Ports: Includes 2x DisplayPort, 4x USB 3.0, 2x USB 2.0, 1x Serial Port, 1x Ethernet (RJ-45) Port, and Audio ports
Use the pattern to choose what to investigate next
- CPU activity rises during the slowdown: Identify the busiest process and compare user with privileged time. Elevated interrupt or DPC activity is a lead for further driver or hardware investigation, not a diagnosis.
- Available memory is low or committed use is high: Compare memory trends with process working sets and, if relevant, paging activity. Commit percentage alone does not tell you whether RAM is the cause.
- Disk latency rises: Correlate the read/write latency with process I/O and the exact symptom window before concluding that storage is the problem.
- No system counter clearly changes: The capture may not have covered the slowdown, or the selected counters may not represent the bottleneck. Revisit when the symptom occurs and collect a focused log over that period.
PerfMon monitors performance counters; Microsoft cautions that counters are not intended for high-frequency collection or application profiling. Microsoft documents a Process V2 counterset for Windows 11 and later to avoid a process-instance issue, but it should not be assumed available in earlier Windows versions. For a quick system check, perfmon /report generates a System Diagnostics report; see Microsoft’s perfmon command reference.
Quick Recap
Product prices and availability are accurate as of the date/time indicated and are subject to change. Any price and availability information displayed on Amazon at the time of purchase will apply.

