
What’s actually slowing this PC down?
Pick the symptom - the matching free tool is one click away.
iTechGuides is reader-supported. When you buy through links on our site, we may earn an affiliate commission. As an Amazon Associate I earn from qualifying purchases. Learn more
When an AWS workload behaves unexpectedly, start by defining what failed and when it began; then compare that timeline with CloudTrail events, AWS Config history, deployment records, and workload or cost signals. No single record necessarily explains the cause: a nearby API event is a lead to verify, not proof that it caused the incident.
What changed in AWS? Start with the symptom and timeline
Write down what the system was expected to do, what happened instead, and which users or workloads were affected. Estimate the earliest onset from alerts, logs, or reports, and record the time zone. A clear start time and scope make it easier to distinguish a resource-specific issue from a shared permission, configuration, or service problem. AWS Builder Center recommends framing the investigation around what was expected, what happened, and who or what was affected: How to Debug AWS Issues When the Error Message Is Not Enough.


Build a short timeline around the earliest known symptom. Check releases and infrastructure changes, permission edits, scaling activity, traffic shifts, scheduled jobs, secret rotations, and relevant service events. A recent deployment is worth checking, but timing alone does not establish that it caused the failure.
Who changed this resource? Search CloudTrail
CloudTrail Event history is the quickest place to look for recent recorded management activity. AWS documents it as a searchable and downloadable, immutable record of the past 90 days of management events in one AWS Region. It is enabled by default, but Event history is limited to one account and Region and does not include data events such as object-level activity. See AWS documentation on working with CloudTrail event history.
#1 Best Overall
Search the affected account and Region
- Open the AWS console in the account and Region where the affected resource resides.
- Open CloudTrail and choose Event history.
- Set a time range around the onset, then search using one available attribute, such as event name, resource, or user identity. Event history supports one attribute filter at a time.
- Open plausible events and inspect the event time, action, identity, and referenced resources. Compare these details with the symptom timeline and expected change.
- Use the console’s comparison or download options if reviewing several candidates; Event history can compare up to five selected events and download results.
Event history is not an organization-wide search and does not support combining several attribute filters in one search. If the relevant activity is older than its retention window, spans accounts or Regions, or involves data events, use an appropriately configured CloudTrail trail or CloudTrail Lake event data store for ongoing capture and broader queries. Data event collection must be configured; it is not supplied by Event history.
When did this start? Compare resource configuration history
A CloudTrail event records activity, while AWS Config can show configuration details, relationships, and changes for supported resource types when recording is enabled. In the AWS Config console, open the relevant resource and inspect its timeline around the incident onset. Compare the recorded state with the expected configuration in the applicable infrastructure-as-code plan and deployment record.
A missing Config timeline is not evidence that nothing changed. The resource type may not be supported, or recording may not have been active. AWS’s documentation for viewing recent management events with the console describes the console workflow and its coverage context. For teams managing infrastructure with Terraform or OpenTofu, plan output can help surface drift, but not every AWS resource is necessarily managed as code. AWS Builder Center also discusses combining CloudTrail, Config, and infrastructure plans in its debugging guide.
Was this a deployment or a manual change?
CloudTrail can identify a recorded API action and the associated identity; it does not by itself tell you whether the action came from a deployment pipeline, an operator, or automation acting under that identity. Match the event time and resource against deployment logs, change records, and the relevant infrastructure plan. If the identity is a role shared by automated jobs or people, use the surrounding pipeline or session context before attributing the change to a particular actor.
Distinguish what the records show from what they imply: an event establishes that a recorded action occurred, while proving that it introduced the faulty state requires matching its target and result to the affected resource and timeline. It does not establish intent.
How do I find what caused my AWS bill to go up?
Begin with the affected dates and cost dimensions, then determine whether the change is usage-driven or rate-driven. AWS describes usage-driven changes as increased resource use at a similar unit price, and rate-driven changes as similar usage at a different unit price. These point to different evidence: investigate resource activity and API calls for usage shifts; inspect cost composition and pricing conditions for rate shifts.
Rank #4

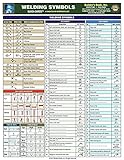
- 🧲 Sticks to Toolboxes & Welders – Heavy-duty magnetic welding chart adheres to metal surfaces like your welding table, toolbox, or wall for instant reference while working.
- 📘 Welding Symbols Quick Card – Includes AWS and ISO welding symbols, weld types, joint notations, and arrow side rules – perfect for blueprint reading and pipefitters.
- 🎯 Built for Training & Field Use – A must-have welding guide for beginners, apprentices, or pros needing a quick weld symbol chart for fabrication or classroom settings.
- 🧰 Fits Any Shop or Setup – Sized at 11" x 8", this welding reference chart mounts cleanly in a workshop, garage, or man cave and doubles as functional metal wall art.
- 🎁 Great Gift for Welders – Makes a thoughtful gift or classroom tool for instructors, mechanics, and DIYers. Pair it with welding books, gear, or training kits.
For usage-driven anomalies, compare cost and line-item usage with CloudTrail calls, IAM identities, CloudWatch resource metrics, and relevant deployment records. AWS’s cost-investigation workflow is intended to connect these signals to a resource, identity, and timeline. A rate-driven change may reflect billing or pricing conditions rather than an API call, so a cost increase does not always have a corresponding person or resource change to find.
The Tool Desk
Outbyte PC Repair FREEClear out junk files and repair common Windows errorsFree Scan →Outbyte Driver Updater FREEScan for outdated or missing drivers - takes under a minuteDriver Scan →AWS-native cost investigation
AWS announced AI-powered cost investigations for AWS Cost Anomaly Detection on June 9, 2026. AWS says an investigation can be started from an anomaly detail page using “Investigate with Amazon Q,” from the AWS FinOps Agent, or through an Amazon Q conversation about AWS costs. AWS describes the feature as analyzing usage- and rate-driven cases and connecting usage changes with API calls and identities. Consult AWS’s announcement for current availability and requirements.
AWS states that the capability is available at no additional charge to customers using Cost Anomaly Detection. Cross-account investigations that query CloudWatch Logs Insights incur standard rates and depend on an organization-wide CloudTrail trail delivered to CloudWatch Logs. Without that setup, AWS says the investigation uses available data and identifies coverage to enable for fuller analysis. AWS also describes event-triggered investigation and optional Jira or Slack delivery on its AWS FinOps Agent page. These are product descriptions, not independent evidence that an investigation will find a definitive cause.
Independent reader supportYour contribution helps us test, update, and keep practical guides available for everyone.Choose the record that fits the question
| Record or feature | Best for | Coverage and limits | Setup or cost notes |
|---|---|---|---|
| CloudTrail Event history | Recent management-event lookup | 90 days in one account and Region; no data events; one attribute filter at a time; no organization-wide aggregation | Enabled by default for management events; no additional setup to view Event history |
| CloudTrail trail or Lake event data store | Ongoing event capture and broader querying | Depends on configured collection and query scope; data events require configuration | Configure the event types and destinations needed; applicable charges depend on the service and setup |
| AWS Config | Supported-resource configuration history and relationships | Only recorded, supported resource types; no timeline does not establish that no change occurred | Recording must be enabled; applicable charges depend on configuration and use |
| Cost anomaly investigation | Correlating cost changes with usage, API activity, identity, and metrics | Analysis depends on available billing and operational data; it may not establish a definitive root cause | AWS says its Cost Anomaly Detection investigation is at no additional charge to its users; cross-account CloudWatch Logs Insights queries incur standard rates |
Report what is confirmed—and what remains unknown
Close the investigation with a compact evidence record: the affected resource and scope, earliest confirmed symptom, relevant event or configuration change, identity shown in the record, and the supporting deployment, metric, or cost evidence. Keep interpretation separate from observation. If logs have expired, a data-event type was not collected, Config did not cover the resource, or the available records do not establish causation, state that limitation and identify the missing context—such as a deployment record, resource owner, or telemetry source.
AWS notes that its cost-investigation capability may explicitly report when available data does not support a definitive root cause. That is a useful standard for any incident review: a defensible unresolved gap is better than assigning cause based only on temporal proximity.
Free tools Windows power users keep installed
One-click scans. No signup required.
Quick Recap
Product prices and availability are accurate as of the date/time indicated and are subject to change. Any price and availability information displayed on Amazon at the time of purchase will apply.

