
Free tools Windows power users keep installed
One-click scans. No signup required.
iTechGuides is reader-supported. When you buy through links on our site, we may earn an affiliate commission. As an Amazon Associate I earn from qualifying purchases. Learn more
Windows 11 gives you several ways to see how much of your graphics processor (GPU) is being used. Task Manager is the quickest option because it shows live utilization, memory use, engine activity, temperature on supported systems, and the application causing the load.
For a simple hardware check, use Settings or Device Manager. If Windows is not identifying the adapter correctly, DirectX Diagnostic Tool can provide a second source of information.
Check GPU usage with Task Manager
Task Manager is the best built-in tool for watching GPU activity while a game, video editor, browser, or other application is running.
- Right-click the Start button and select Task Manager. You can also press Ctrl + Shift + Esc.
- If Task Manager opens in its compact view, select More details.
- Select Performance in the left pane.
- Select GPU 0, GPU 1, or another GPU entry. The entry may be near the bottom of the list.
The GPU page displays live graphs for activity such as 3D, Copy, Video Decode, and Video Processing. The exact graphs depend on the GPU and its driver. The GPU model appears in the upper-right corner of the page.
#1 Best Overall

- 2 x 92mm fans combined into one interface, can be connected to the motherboard's 3-pin or 4-pin interface and you only need to access one interface to run all the fans
- This cooling fan's total size is 7.36in(L) x 4.72in(W) x 1.18in(H), designed for most universal graphic card video card VGA cooling,just please check the size to make sure your pc has enough space
- D-type interface cable included four interfaces, three voltages: 5V, 7V and 12V; different voltages with different airflow, speed and noise. You can select the appropriate voltage interface to start the fan
- The double ball bearing has a service life of 65,000 hours, and the 7 blades produce strong airflow to keep the computer case cool
- packing list: 2 x 92mm fans (PCI bracket screwed), 1 x multi-voltage cable ,1 x mini screwdriver,1 x fixing screw
What the Task Manager figures mean
| Item | What it tells you |
|---|---|
| Utilization | How busy a particular GPU engine is. A high 3D percentage usually means a game or 3D application is actively rendering. |
| Dedicated GPU memory | Video memory reserved on the graphics card. It is commonly called VRAM. |
| Shared GPU memory | System RAM that Windows can make available to the GPU. It is not the same as dedicated VRAM. |
| GPU engine | The GPU engine used by an application, such as GPU 0 - 3D or GPU 1 - Video Decode. |
To identify the program creating the load, return to the Processes tab. Right-click a column heading, enable GPU and GPU engine, and then select the GPU column to sort by usage. This lets you distinguish a game using the 3D engine from a browser using the video-decoding engine.
See GPU usage by application
- Open Task Manager with Ctrl + Shift + Esc.
- Select Processes.
- Right-click any column heading, such as Name or CPU.
- Enable GPU and GPU engine if they are not already visible.
- Select the GPU heading to sort applications from highest to lowest usage.
The percentage in the Processes view is the highest utilization reported among the application’s GPU engines, not necessarily an average of every engine. For example, an application may show substantial GPU usage because its 3D engine is busy even though its video-decoding activity is low.
If you want to measure a specific program, start Task Manager before opening it, leave the program running for several seconds, and watch the relevant GPU graph while reproducing the activity. A brief spike is normal; sustained high usage is more useful when diagnosing performance.
What’s actually slowing this PC down?
Pick the symptom - the matching free tool is one click away.
Check which GPU Windows 11 recognizes
Task Manager can omit the GPU section when Windows cannot access the adapter correctly. Use one of these checks to confirm that the hardware is detected.
Rank #2
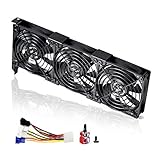
- 3 x 92mm fans combined into one interface, can be connected to the motherboard's 3-pin or 4-pin interface and you only need to access one interface to run all the fans
- This cooling fan's total size is 11in(L) x 4.72in(W) x 1.18in(H), designed for most universal graphic card video card VGA cooling,just please check the size to make sure your pc has enough space
- D-type interface cable included four interfaces, three voltages: 5V, 7V and 12V; different voltages with different airflow, speed and noise. You can select the appropriate voltage interface to start the fan
- The double ball bearing has a service life of 65,000 hours, and the 7 blades produce strong airflow to keep the computer case cool
- packing list: 3 x 92mm fans (PCI bracket screwed), 1 x multi-voltage cable ,1 x mini screwdriver,1 x fixing screw
Settings
- Open Settings.
- Go to System > Display.
- Scroll down and select Advanced display under Related settings.
- Read the adapter make and model under Display information.
The current Windows 11 label is Advanced display, rather than the older “Advanced display settings” wording used in some Windows 10 instructions. This page identifies the adapter associated with the selected display, but it is not a live GPU-monitoring dashboard.
Device Manager
- Right-click Start and select Device Manager.
- Expand Display adapters.
- Read the adapter names listed there.
Multiple entries are normal on many laptops. For example, one entry may be an integrated Intel or AMD GPU and another may be a discrete NVIDIA or AMD GPU. The application may use either one depending on its graphics settings and the laptop’s power mode.
If the entry is Microsoft Basic Display Adapter, Windows is using its generic display driver instead of the manufacturer’s driver. The GPU hardware may still be present, but the generic driver can limit performance, resolution options, video playback, multiple-monitor support, and other graphics features.
Do these 3 things before closing this tab:
1Fix the driver behind crashes, sound loss and screen glitches2Repair Windows errors before they cause bigger problems3Scan for outdated or missing drivers - takes under a minuteUse DxDiag for a detailed adapter check
DirectX Diagnostic Tool, or DxDiag, is useful when you need the adapter name and driver information for technical support.
Rank #3
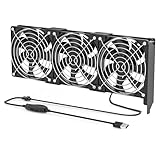
- 【Durable & Compact Design】This cooling fan is built with high-quality materials for enhanced durability. Its compact size makes it easy to install in tight spaces, providing reliable active cooling for graphics cards or server components
- 【Broad Compatibility for High-Performance Hardware】Ideal for graphics cards and other server hardware that require additional cooling. Perfect for use in consumer chassis with limited airflow to improve system stability and performance
- 【Adjustable Fan Speed for Custom Airflow】With a speed range of 1500–3000 RPM, the fan allows you to fine-tune airflow based on your cooling needs. Whether you prioritize silent operation or maximum cooling, this fan gives you full control
- Flexible Power Options with USB & 4-Pin Support】Comes with a USB to 4-PIN PWM cable for easy 12V power connection. The fan can be turned on or off manually, offering flexible control
- 【Complete Kit, Ready to Install】Includes 1 x cooling fan, 1 x USB to 4-PIN cable, and 1 x mounting screw. Everything you need for a quick and hassle-free installation—no additional parts required
- Right-click Start and select Run.
- Enter
dxdiag.exeand select OK. - If Windows asks whether it should verify digitally signed drivers, select Yes.
- Open the Display tab.
- In the Device section, read the value next to Name.
Some computers have more than one Display tab. Check each tab because the adapters can have different names and drivers. DxDiag identifies the hardware and reports driver details, but it does not provide the same live utilization graphs as Task Manager.
To create a report, select Save All Information… in DxDiag and save the text file. You can attach that file when asking for graphics support. Do not confuse DxDiag with a way to install a newer DirectX version: Windows 11 receives DirectX updates through Windows Update.
What to do if GPU usage is missing
GPU is not listed in Task Manager
First check Device Manager > Display adapters and the Display tab or tabs in DxDiag. A missing GPU panel does not by itself prove that the computer has no GPU. The adapter may be using a generic driver, may be disabled, or may not expose the performance counters Task Manager needs.
Also check whether the graphics driver is working:
- Open Device Manager.
- Expand Display adapters.
- Right-click the adapter and select Properties.
- Read the message on the General tab and inspect the Device status area.
If the adapter has a warning icon or is identified as Microsoft Basic Display Adapter, install the correct driver from the computer manufacturer’s support page or the GPU manufacturer’s official site.
Rank #4
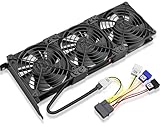
- Package include: 1 Piece Graphic Card Fans ( 3-Fans connected ) with 1*Power D-type Interface cable
- Dimension: 92mm(L) x 92mm(W) x 25mm(H) / 3.62in(L) x 3.62in(W) x 1in(H) in per fan. Totally Size: 276mm(L) x 120mm(W) x 30mm(H) / 10.86in(L) x 4.72in(W) x 1.18in(H)
- Rated Voltage: DC 12V; Rated Current: 0.45Amp; Rated Speed: 3x 1800 RPM; Air flow: 3x 39.8 CFM; Noise: 3x 24.8 dBA
- D-type interface cable included four interfaces, three voltages: 5V 7V and 12V; Different voltages with different airflow, speed, and noise. you can select the appropriate voltage interface to start the fan.
- 3 fans combined into one interface, Can be connected to the motherboard's 3-pin or 4-pin interface and you only need to access one interface to run all the fans.
Update the display driver
- Search Windows for Device Manager and open it.
- Expand Display adapters.
- Right-click the adapter.
- Select Update driver and follow the prompts.
For laptops, the manufacturer’s driver may be preferable because it is tested for that model’s display switching and power-management system.
Recover from a display-driver problem
If the problem began immediately after a driver update, open Device Manager > Display adapters > [adapter] > Properties > Driver > Roll Back Driver. Select Yes and restart Windows. The option is unavailable when Windows has no previous driver to restore, and administrator permission is required.
You can also reset the graphics driver without restarting by pressing Windows + Ctrl + Shift + B. The screen may briefly flicker or go black. This can fix some temporary display problems, but it will not repair a missing or incorrect driver.
Quick wins for a faster PC:
Fix the driver behind crashes, sound loss and screen glitchesFind Drivers →Clear out junk files and repair common Windows errorsFree Scan →Scan for outdated or missing drivers - takes under a minuteDriver Scan →How to interpret high or low GPU usage
| Observation | Likely meaning | What to check |
|---|---|---|
| High 3D usage while gaming | The GPU is rendering heavily. This is usually expected. | Frame rate, temperature, resolution, and whether the game is meeting its target performance. |
| Low GPU usage and low frame rate | The game may be limited by the CPU, an FPS cap, power settings, or another bottleneck. | Task Manager CPU usage, the game’s frame-rate limit, and Windows power mode. |
| High Video Decode usage | Video playback or another media workload is using the GPU’s video engine. | Video resolution, browser tabs, media-player activity, and driver status. |
| High dedicated-memory usage | Games or creative applications are using much of the GPU’s VRAM. | Texture quality, resolution, open applications, and possible stuttering when memory is exhausted. |
| Usage stays high when no program is active | A background application, desktop effect, browser tab, malware, or driver issue may be responsible. | Sort the Processes tab by GPU and inspect the GPU engine column. |
GPU utilization is not a quality score. A GPU running at 95% while producing the desired frame rate may be working normally. Conversely, 20% utilization with severe stuttering can indicate a CPU, memory, storage, thermal, driver, or frame-pacing problem.
Best Value

- Suitable for ASUS RTX 3050 PHOENIX / RTX 3060 PHOENIX
- Incompatible with other Graphics Card
- Fan diameter:95mm
- Power connector: 6 Pin
Which method should you use?
| Goal | Best method |
|---|---|
| Watch live GPU activity | Task Manager > Performance > GPU |
| Find the application using the GPU | Task Manager > Processes, with GPU and GPU engine columns enabled |
| Confirm the adapter connected to a display | Settings > System > Display > Advanced display |
| Check every installed adapter | Device Manager > Display adapters |
| Provide driver and adapter details to support | DxDiag, using Save All Information… |
FAQ
How do I check GPU usage in Windows 11?
Open Task Manager with Ctrl + Shift + Esc, select Performance, and select the GPU entry. The page shows live utilization graphs and GPU memory usage. To see which program is responsible, enable the GPU and GPU engine columns on the Processes tab.
Why is GPU missing from Task Manager in Windows 11?
Check Device Manager under Display adapters and run DxDiag with the command dxdiag.exe. The adapter may be using Microsoft Basic Display Adapter, may be disabled, or may not expose the performance data Task Manager requires.
Is 100% GPU usage bad?
Not necessarily. Sustained high usage is normal when a game or rendering application is using the GPU fully. Investigate temperatures, crashes, visual artifacts, and frame rate rather than treating the percentage alone as a fault.
Outdated Drivers Are Slowing You Down
One free scan finds every outdated or missing driver and matches the right update for your exact hardware.Free scan · exact hardware matchWindows Errors? Fix Them Before They Spread
Repair common Windows errors and clear accumulated junk for a smoother, more stable PC - no reinstall needed.Free scan · no reinstallHow can I see my GPU model in Windows 11?
Use Settings > System > Display > Advanced display and read Display information, or open Device Manager and expand Display adapters. DxDiag also lists the model on its Display tab under Device > Name.
What does Microsoft Basic Display Adapter mean?
It means Windows is using a generic display driver rather than the manufacturer’s driver. The GPU hardware may still be installed, but installing the correct manufacturer-specific driver can restore better performance and graphics features.
The Bottom Line
For live monitoring, use Task Manager > Performance > GPU. Use the Processes tab to identify the application creating the load, and use Device Manager or dxdiag.exe when the GPU entry is missing or the driver appears incorrect.
Quick Recap
Product prices and availability are accurate as of the date/time indicated and are subject to change. Any price and availability information displayed on Amazon at the time of purchase will apply.

