
iTechGuides is reader-supported. When you buy through links on our site, we may earn an affiliate commission. As an Amazon Associate I earn from qualifying purchases. Learn more
Dynatrace Application Performance Monitoring vs. ScienceLogic SL1 is primarily a fit decision, not a feature-for-feature contest. Choose Dynatrace for deep application tracing, code-level diagnosis, profiling, user experience, and automated application root-cause analysis. Choose ScienceLogic SL1—now branded Skylar One—for broad hybrid infrastructure, network, service-context, event, and IT workflow operations.
The two platforms overlap in application monitoring, infrastructure visibility, topology, anomaly detection, and automation, but their centers of gravity differ. Dynatrace is application-centric and expands into full-stack observability. SL1/Skylar One is operations-centric and expands from infrastructure and service context into application monitoring.
Key takeaways
- Dynatrace Full-Stack Monitoring explicitly includes distributed tracing, code-level visibility, CPU and memory profiling, and deep process monitoring.
- ScienceLogic SL1 is now called Skylar One in current ScienceLogic documentation and is positioned around hybrid, multi-vendor visibility, discovery, event operations, service context, and automation.
- Dynatrace’s displayed 2026 list-price signals include $58 per 8 GiB host per month for Full-Stack Monitoring, while ScienceLogic public list pricing was not found in the reviewed official sources.
- SL1 application monitoring should not automatically be treated as equivalent to developer-oriented APM; buyers must validate traces, profiling, instrumentation, and runtime diagnostics against real workloads.
- A combined deployment can provide Dynatrace application depth and SL1 operational breadth, but it can also create duplicate alerts, topology models, telemetry costs, and ownership confusion.
What is the difference between Dynatrace and ScienceLogic SL1?
Dynatrace is generally the stronger starting point when the central problem is application performance: slow transactions, failed requests, code regressions, database calls, microservice dependencies, or user-experience degradation. ScienceLogic SL1—now branded Skylar One—is generally the stronger starting point when the central problem is operational context across networks, servers, storage, cloud services, legacy systems, business services, and IT workflows.
The distinction matters because “application monitoring” can describe two different levels of capability:
#1 Best Overall
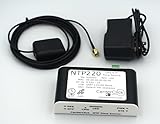
- Stratum 1 NTP with GPS Source
- Embedded View-only Webserver with Status & Graphs
- Admin Console via USB and SSH
- JSON Encoded Raw Data for Custom Integration
- I/O Connector
| Monitoring level | What it answers | Typical buyer need |
|---|---|---|
| Application-aware operations monitoring | Is the application available? Which infrastructure or dependency is affected? Which business service has an impact? | NOC, ITOps, service management, MSP, and infrastructure operations |
| Deep application performance monitoring | Which transaction, service, method, database statement, external call, or code path caused the latency or error? | Developers, SREs, DevOps, and application operations |
SL1 can monitor applications and their relationships with infrastructure, but the precise diagnostic depth depends on the application technology, connector, agent, API, protocol, PowerPack, or custom Dynamic Application. Dynatrace’s documented Full-Stack capability is more directly aligned with deep APM because it includes tracing, code visibility, profiling, and process monitoring.
What does Dynatrace primarily do?
Dynatrace provides application-centric full-stack observability built around automatic instrumentation, topology, telemetry analytics, and AI-assisted analysis. Its documented platform components include OneAgent, Smartscape, Grail, Dynatrace Intelligence, OpenPipeline, AppEngine, and AutomationEngine; commercial packaging determines which capabilities and data types are included.
Dynatrace Full-Stack Monitoring documentation specifically describes distributed tracing, code-level visibility, CPU and memory profiling, and deep process monitoring. Those capabilities let a team move from an alert or service symptom toward the transaction, process, method, query, or dependency responsible.
Free tools Windows power users keep installed
One-click scans. No signup required.
- Application performance: transaction response time, errors, service health, and dependency behavior.
- Distributed tracing: request paths across microservices, APIs, databases, queues, and other supported components.
- Code-level diagnostics: method-level visibility and runtime evidence for supported languages and frameworks.
- Profiling: CPU and memory analysis for investigating hotspots and runtime behavior.
- Topology: Smartscape maps dynamic relationships among application components and infrastructure.
- Cloud-native monitoring: Kubernetes, containers, cloud services, serverless workloads, and modern service architectures.
- User experience: real-user monitoring and synthetic testing.
- Telemetry analytics: logs, metrics, traces, events, and related data can be analyzed together through the platform.
- Security and automation extensions: the platform also lists application security, AppEngine, and AutomationEngine capabilities, subject to package and licensing verification.
Dynatrace’s platform overview describes Grail as a data lakehouse and identifies DQL-based analytics, Smartscape topology, OneAgent, and Dynatrace Intelligence as central platform elements. These are platform capabilities, not a guarantee that every capability is included in every purchased package.
What does ScienceLogic SL1, now Skylar One, primarily do?
ScienceLogic SL1—called Skylar One in current product documentation—provides unified observability and IT operations for hybrid and multi-vendor environments. The platform emphasizes discovery, infrastructure and application monitoring, relationship mapping, event collection and correlation, business-service context, integrations, and workflow automation.
Current Skylar One documentation confirms the SL1-to-Skylar One naming relationship. Buyers should retain “ScienceLogic SL1” in searches and procurement documents while checking current product names, release versions, and licensing with ScienceLogic.
- Discovery: device, hardware, software, interface, port, DNS, certificate, topology, and SNMP information can be collected through supported methods.
- Infrastructure monitoring: servers, networks, storage, databases, cloud services, virtual systems, and other operational domains.
- Application monitoring: supported packaged and cloud applications, databases, web services, ERP systems, Office 365, and orchestration applications.
- Event operations: event collection, deduplication, correlation, notification, anomaly detection, and operational prioritization.
- Business services: application-to-infrastructure relationships and service views help operators understand impact beyond an individual device alert.
- Integrations: PowerPacks, APIs, and third-party connections extend monitoring across heterogeneous estates.
- Automation: Run Book Automation and PowerFlow support operational actions and ITSM workflows.
The SL1 feature overview describes discovery, topology, monitoring, anomaly detection, dashboards, reports, and automation. ScienceLogic also claims more than 500 pre-built integrations spanning more than 100 vendors and thousands of device types on its AIOps platform page; that figure is a vendor claim, not an independently audited measurement.
Recommended Free Tools
Are Dynatrace and SL1 direct competitors?
Dynatrace and SL1 are partial competitors because both can contribute to observability consolidation, hybrid-cloud monitoring, topology, event analysis, anomaly detection, and incident response. They are not identical APM products, however, and a comparison based only on feature checkboxes can produce the wrong selection.
| Evaluation dimension | Dynatrace | SL1/Skylar One |
|---|---|---|
| Primary orientation | Application and full-stack observability | IT operations, hybrid infrastructure, services, and AIOps |
| Deep code-level APM | Core strength, with documented tracing, visibility, and profiling | Validate by workload, integration, agent, and license; do not assume parity |
| Network and device monitoring | Available in the broader platform, but not the central product identity | Central use case for heterogeneous operational estates |
| Application dependency mapping | Smartscape and application telemetry emphasize service diagnosis | Operational relationships emphasize service impact and infrastructure context |
| Discovery | Strong automatic discovery and instrumentation for supported modern environments | Core operating model across devices, infrastructure, applications, and integrations |
| Business-service context | Available through topology and business-oriented capabilities | Central to service and operations views |
| ITSM and workflow automation | AutomationEngine and platform integrations are available; package inclusion requires verification | PowerFlow and Run Book Automation are major operational differentiators |
| Deployment | SaaS, Managed, and hybrid arrangements have different licensing and operating implications | SaaS, on-premises, and distributed deployment options require architecture review |
| Pricing transparency | Public consumption-rate signals are available | No public SL1 list-price schedule was found in the reviewed official sources |
| Best initial users | Developers, SREs, DevOps, and application operations | ITOps, NOC, service managers, infrastructure teams, and MSP operators |
Which platform is better for application instrumentation?
Dynatrace is the more natural candidate for automatic application instrumentation and deep runtime visibility, but the buyer should test the exact languages, runtimes, frameworks, deployment model, and instrumentation policy required in production.
For either platform, evaluate agent-based and agentless collection rather than assuming one product uses only one method. The practical questions are whether the required applications can be covered, how much configuration is needed, what resource overhead is acceptable, and whether the resulting data supports the diagnosis the team actually needs.
| Instrumentation question | Dynatrace evaluation | SL1/Skylar One evaluation |
|---|---|---|
| Automatic instrumentation | OneAgent is designed to automatically discover and instrument supported applications, services, infrastructure, and dependencies | Coverage may depend on integrations, PowerPacks, agents, APIs, protocols, or custom Dynamic Applications |
| Distributed services | Test microservices, APIs, queues, databases, serverless functions, and service meshes | Verify whether the selected integration provides transaction-level traces or only health and dependency data |
| OpenTelemetry | Verify ingestion, supported signals, configuration, and whether imported data retains the needed context | Verify supported OpenTelemetry paths and how imported telemetry participates in topology, events, and workflows |
| Legacy applications | Test supported runtimes and applications where deep agents may be unavailable or restricted | Application monitoring can be useful for packaged and legacy systems, but diagnostic depth must be demonstrated |
| Black-box systems | Use infrastructure, synthetic, API, or supported service monitoring where code instrumentation is unavailable | Use protocols, credentials, APIs, PowerPacks, and custom collection where agents cannot be installed |
| Operational impact | Measure OneAgent resource use, upgrade controls, proxy requirements, and security approval effort | Measure collector, appliance, credential, polling, and custom-collection overhead |
Do not approve a platform because a vendor says it “supports” a technology. “Support” may mean an availability check, a set of infrastructure metrics, application health, or a full transaction trace. Require the vendor to demonstrate the evidence at the depth your incident process requires.
What’s actually slowing this PC down?
Pick the symptom - the matching free tool is one click away.
Rank #2

- 【Up to 1100 Mbps VPN Speed 】 Hardware-accelerated WireGuard and OpenVPN-DCO deliver up to 1100 Mbps VPN throughput, over 3× faster than Brume 2 for smooth remote access and file transfers.
- 【Three 2.5G Ports & Multi-WAN】Tri-port 2.5GbE design with flexible WAN LAN configuration supports multi-gigabit wired setups, dual-ISP Multi-WAN and failover to keep home and SOHO networks online.
- 【Stealth VPN Obfuscation】VPN obfuscation disguises VPN traffic as regular HTTPS, helping you evade blocking, bypass restrictive networks and maintain stable, private connections.
- 【DPI protection】Deep Packet Inspection with visual dashboards blocks adult/gambling/malicious sites, while SQM and QoS prioritize gaming, calls, and video when bandwidth is tight
- 【OpenWrt & USB 3.0 Expansion】OpenWrt with 1GB DDR4 and 8GB eMMC lets you install plugins and build VPN, ad-blocking or NAS, while USB 3.0 Type‑C connects high-speed storage or 4G/5G dongles
How do Dynatrace and SL1 compare for distributed tracing?
Distributed tracing is likely to be the decisive category for a buyer choosing between deep APM and operations-centric monitoring. Dynatrace explicitly documents distributed tracing as part of Full-Stack Monitoring, while the reviewed SL1 material does not establish equivalent tracing and code-diagnostic depth across arbitrary applications.
Ask both vendors to trace the same request across a web front end, several microservices, an asynchronous queue, a database, and a third-party API. The demonstration should show whether the platform identifies the slow method, database statement, external call, or code path—not merely that a downstream component is unhealthy.
Also verify:
- How much manual instrumentation is required.
- Which languages, frameworks, queues, databases, serverless platforms, and service meshes are supported.
- Whether trace data is retained for the period needed by investigations.
- Whether tracing is included in the selected license or metered separately.
- How traces connect to logs, metrics, deployments, user sessions, and topology.
- Whether developers can move from an alert to a trace and then to code-level evidence.
According to the Dynatrace pricing page reviewed for this comparison, Full-Stack Monitoring displays 10 days of trace-data retention, with longer retention available as an extension. Retention, ingest, and query terms must be confirmed in the buyer’s actual proposal because pricing and packaging can change.
Which platform provides better code-level diagnostics and profiling?
Dynatrace has the clearer documented fit for method-level troubleshooting, CPU and memory profiling, runtime investigation, exception analysis, and production application diagnosis. Dynatrace’s Full-Stack Monitoring documentation identifies code-level visibility and CPU and memory profiling as included capability areas.
SL1 should be evaluated primarily for application health, dependency context, infrastructure relationships, event correlation, and operational response unless ScienceLogic demonstrates the required runtime diagnostics for the buyer’s specific technology stack. Do not infer full code profiling from the phrase “application monitoring.”
A useful proof test includes a known CPU regression, a memory leak, a slow database query, an exception spike, and a failed deployment. Score whether each platform identifies the affected service, narrows the problem to a process or method, presents supporting evidence, and gives developers enough information to reproduce or repair the issue.
Which platform is stronger for infrastructure, network, and hybrid environments?
SL1/Skylar One is generally the stronger fit when monitoring must begin with a heterogeneous infrastructure estate rather than with instrumented application code.
ScienceLogic’s SL1 feature documentation describes discovery of devices, hardware components, software applications, open ports, DNS information, SSL certificates, network interfaces, topology, and SNMP information. That breadth is particularly relevant to NOCs, infrastructure teams, service providers, and enterprises consolidating multiple monitoring tools.
Outdated Drivers Are Slowing You Down
One free scan finds every outdated or missing driver and matches the right update for your exact hardware.Free scan · exact hardware matchWindows Errors? Fix Them Before They Spread
Repair common Windows errors and clear accumulated junk for a smoother, more stable PC - no reinstall needed.Free scan · no reinstallCompare the platforms against the actual estate:
| Environment | What to validate | Likely fit emphasis |
|---|---|---|
| Cloud-native microservices | Traces, code paths, Kubernetes context, deployment correlation, and user impact | Dynatrace |
| Network and device estate | Discovery, SNMP, interfaces, topology, certificates, ports, and event operations | SL1/Skylar One |
| Hybrid data center and public cloud | Coverage across physical, virtual, cloud, network, applications, and service relationships | Often SL1/Skylar One, or both |
| Legacy packaged applications | Available collectors, APIs, credentials, application health, and dependency context | Workload-dependent; test both |
| Agent-restricted systems | Agentless protocols, collectors, synthetic checks, APIs, and monitoring depth | Workload- and architecture-dependent |
| Highly ephemeral Kubernetes | Topology accuracy, short-lived workload visibility, trace continuity, and retention | Often Dynatrace for application diagnosis; validate operational requirements |
Dynatrace can monitor infrastructure and network-adjacent domains, and OneAgent is designed to discover supported modern applications, microservices, infrastructure, and dependencies. SL1’s operating model is more naturally centered on broad multi-vendor discovery and operations. The correct choice depends on whether the buyer needs deep diagnosis inside applications or reliable context across every operational domain.
How do their topology and dependency maps differ?
Dynatrace topology is primarily designed to explain dynamic application relationships and service behavior, while SL1 topology is primarily designed to provide operational context, service impact, infrastructure relationships, and event/action decisions.
Dynatrace documentation describes Smartscape as a way to visualize dynamic relationships among application components across tiers. ScienceLogic describes contextual visibility and bi-directional interdependencies between applications and associated systems in its application monitoring material.
Rank #3

- Product Type :System Power Device
- Package Dimensions :23.114 Cm L X 16.764 Cm W X 5.08 Cm H
- Country Of Origin :Italy
- Package Weight :0.62Lbs
| Topology question | Dynatrace emphasis | SL1/Skylar One emphasis |
|---|---|---|
| What caused a slow transaction? | Trace and service dependency path | Application and infrastructure relationship, subject to integration depth |
| Which business service is affected? | Application topology and business-context capabilities | Business-service and operational service views |
| Which network or device relationship matters? | Validate the specific network integration and topology coverage | Device, interface, network, and infrastructure relationships are central use cases |
| How should an alert be handled? | Use causal context and application evidence | Use service context, event correlation, ownership, and workflow automation |
| How well does the map handle ephemeral workloads? | Test dynamic cloud-native discovery and retention | Test collector, integration, and topology behavior for short-lived resources |
How do alerting, AIOps, and root-cause analysis compare?
Both platforms use correlation, anomaly detection, topology, and AI-oriented features, but vendor language such as “AI-powered” does not establish equivalent root-cause accuracy or reduced incident time.
Dynatrace describes Dynatrace Intelligence as combining predictive, causal, and generative AI for observability, security, and business use cases. ScienceLogic describes SL1/Skylar One as collecting and correlating telemetry into business context and supporting intelligent automation; its documentation also includes machine-learning anomaly detection and Run Book Automation.
Test both platforms with the same incidents:
- A cascading infrastructure failure affecting several services.
- A slow database affecting multiple application transactions.
- A noisy deployment that introduces errors and latency.
- A third-party API degradation.
- A network problem affecting an application.
- A genuine application code regression.
For every incident, require the platform to show the evidence behind its conclusion. Score alert grouping, deduplication, causal explanation, affected-business-service identification, false positives, false negatives, confidence indicators, audit history, and the ability to suppress or roll back an automated action.
Which platform is better for ITSM integration and workflow automation?
SL1/Skylar One is usually the stronger fit when the buying decision is driven by operational orchestration, ITSM integration, and closed-loop workflows.
ScienceLogic PowerFlow documentation describes integrations with applications such as ServiceNow, xMatters, Opsgenie, and Cherwell, along with reusable workflow steps and drag-and-drop workflow construction. SL1 also provides Run Book Automation for operational actions.
Do these 3 things before closing this tab:
1Clear out junk files and repair common Windows errors2Fix the driver behind crashes, sound loss and screen glitches3Repair Windows errors before they cause bigger problemsEvaluate:
- Incident creation, enrichment, updates, and closure.
- Bi-directional synchronization with the ITSM platform and CMDB.
- Event suppression, maintenance windows, and deduplication.
- Approval gates before remediation.
- Webhooks, APIs, and reusable runbooks.
- Role-based permissions and separation of duties.
- Workflow testing, auditability, error handling, and rollback.
- Licensing for integrations, automation, collectors, and professional services.
Dynatrace does not lack automation. Its current platform documentation lists AutomationEngine and AppEngine, but the buyer must verify the exact automation functions, permissions, data access, and commercial package included in the proposed deployment.
How do dashboards and analytics differ?
Dynatrace is optimized for exploring high-dimensional application telemetry and moving among logs, metrics, traces, topology, user experience, and service evidence. SL1 is optimized for operational dashboards, maps, reports, business services, event views, APIs, and cross-domain monitoring context.
| Analytics task | Platform to investigate first | Reason |
|---|---|---|
| Find a slow transaction | Dynatrace | Application traces, service dependencies, and code-level diagnostics are central strengths |
| Explain service impact | Both | Compare business-service modeling, topology accuracy, and incident views |
| Build a NOC dashboard | SL1/Skylar One | Operational data, maps, events, devices, and services are central use cases |
| Query correlated observability data | Dynatrace | Grail and DQL provide a platform analytics model; validate cost and retention |
| Report across customers or tenants | SL1/Skylar One | Validate multi-tenant, service-provider, access-control, and reporting requirements |
| Export to external analytics | Both | Compare APIs, data access, query limits, retention, and integration effort |
Dashboards should be judged by the decisions they support, not by the number of widgets available. Ask application teams to investigate a regression, NOC teams to prioritize a service-impacting event, and executives to review service health using the same representative data.
How much does Dynatrace cost compared with SL1?
Dynatrace publishes consumption-oriented list-price signals, while ScienceLogic SL1 pricing was not publicly posted in the official material reviewed for this comparison. Dynatrace prices therefore provide a starting point, not a final contract comparison, and SL1 requires a quote and workload model.
According to Dynatrace’s 2026 pricing material reviewed for this article, displayed list-price signals include:
| Dynatrace capability | Displayed price signal | Billing unit shown |
|---|---|---|
| Foundation & Discovery | $7 per host per month | $0.01 per host-hour |
| Infrastructure Monitoring | $29 per host per month | $0.04 per host-hour |
| Full-Stack Monitoring | $58 per 8 GiB host per month | $0.01 per memory-GiB-hour |
| Kubernetes Platform Monitoring | $1.40 per pod per month | $0.002 per pod-hour |
| Code Monitoring | $3.60 per container per month | $0.005 per container-hour |
| Real User Monitoring | $2.25 per 1,000 sessions | Session-based |
| RUM with Session Replay | $4.50 per 1,000 sessions with replay capture | Session-based |
| Browser synthetic monitoring | $4.50 per 1,000 synthetic actions | Action-based |
| HTTP synthetic monitoring | $1 per 1,000 synthetic requests | Request-based |
| Log Analytics | $0.20 per GiB ingest/process; $0.0007 per GiB-day retained; $0.0035 per GiB scanned | Data-volume and query-based |
The displayed Dynatrace monthly equivalents are not necessarily invoices calculated as a simple monthly subscription. Dynatrace licensing documentation describes Dynatrace Platform Subscription, or DPS, as a consumption-based model and documents annual commitment arrangements commonly lasting one to three years with a minimum annual commitment. Confirm current terms, geography, taxes, support, discounts, deployment type, and package inclusion before using the figures in a business case.
Rank #4

- Features Humidity monitoring; Temperature monitoring
Do not estimate Dynatrace cost from host count alone. Full-Stack Monitoring is tied to memory consumption, while logs, traces, metrics, real-user sessions, synthetic actions, retention, and query volume can create additional cost dimensions. A small number of large hosts can produce a very different result from a large number of small hosts.
For SL1, request a three-year total-cost model covering software, SaaS or appliance deployment, collectors, PowerPacks, integrations, automation, support, implementation, professional services, upgrades, high availability, disaster recovery, and staffing. The absence of a public price is not evidence that SL1 is cheaper or more expensive.
Quick wins for a faster PC:
Clear out junk files and repair common Windows errorsFree Scan →Fix the driver behind crashes, sound loss and screen glitchesFind Drivers →What deployment and architecture constraints matter?
Deployment constraints can outweigh feature differences. The buyer must evaluate data residency, network egress, proxies, certificates, agent permissions, collector placement, air-gap requirements, upgrade ownership, high availability, disaster recovery, and operational staffing.
| Constraint | Dynatrace questions | SL1/Skylar One questions |
|---|---|---|
| SaaS and data residency | Which SaaS, Managed, or hybrid arrangement meets residency and security requirements? | Which SaaS, on-premises, or distributed deployment meets residency and security requirements? |
| Collection architecture | Where can OneAgent, OpenTelemetry, synthetic private locations, and proxies run? | Where must collectors, appliances, database, user interface, and message collection functions run? |
| Disconnected or restricted systems | What happens when monitored hosts lose connectivity, and which data is retained locally? | Can supported agentless protocols, collectors, or local components monitor the system? |
| Operations responsibility | Who controls agents, upgrades, configuration, retention, and cost governance? | Who operates upgrades, capacity, high availability, PowerPacks, collectors, and disaster recovery? |
| Scaling | Model host memory, telemetry, cardinality, retention, and query growth | Model device count, polling, event volume, tenants, collectors, integrations, and storage |
ScienceLogic installation documentation describes distributed SL1 functions including database, user interface, data collection, and message collection, with all-in-one and larger distributed deployments. Exact architecture depends on the release and deployment type; do not reuse an SL1 menu path or installation assumption without checking the corresponding current documentation.
Dynatrace also has deployment and licensing distinctions. Dynatrace cost-management documentation should be reviewed alongside the license and capability pages when comparing SaaS, Managed, hybrid, legacy, or classic arrangements.
Independent reader supportYour contribution helps us test, update, and keep practical guides available for everyone.When should you choose Dynatrace?
Choose Dynatrace first when the main operational question is “which application transaction, service, method, query, or dependency is failing or becoming slow?” Dynatrace is especially suitable when:
The Tool Desk
Outbyte Driver Updater FREEFix the driver behind crashes, sound loss and screen glitchesFind Drivers →Outbyte PC Repair FREEClear out junk files and repair common Windows errorsFree Scan →- The organization is developer-heavy and operates cloud-native services, APIs, Kubernetes, containers, or serverless workloads.
- Developers and SREs need distributed traces, code-level visibility, profiling, and deployment correlation.
- Application discovery and dynamic service dependency mapping are high priorities.
- The buyer wants application performance, infrastructure, logs, real-user monitoring, and synthetic testing in one application-centric platform.
- The organization can govern consumption-based pricing, telemetry volume, retention, and cardinality.
- Deep application diagnosis matters more than broad device-level operations coverage.
Dynatrace may be a poor fit for a small team that needs only basic uptime checks, simple infrastructure metrics, or highly predictable fixed pricing. That conclusion should come from a workload and quote, not from the existence of consumption pricing alone.
When should you choose SL1 or Skylar One?
Choose SL1/Skylar One first when the main operational question is “which devices, systems, dependencies, or business services are affected, and what should operations do next?” SL1/Skylar One is especially suitable when:
- The environment contains network devices, physical and virtual infrastructure, cloud services, legacy platforms, databases, and applications from many vendors.
- The primary users are ITOps, NOC analysts, infrastructure engineers, service managers, or MSP operators.
- Discovery, event correlation, business-service modeling, service impact, and ITSM workflows are central requirements.
- On-premises or distributed deployment is important for security, residency, architecture, or operational reasons.
- The organization wants to consolidate multiple infrastructure and operations monitoring tools.
- Some monitored systems cannot accept a deep application agent.
SL1/Skylar One may be a poor fit when the overriding requirement is developer-level tracing, method profiling, or detailed production code diagnosis and the selected SL1 integrations cannot demonstrate that depth for the target stack.
When does a combined Dynatrace and SL1 deployment make sense?
A combined deployment makes sense when Dynatrace supplies deep APM and developer diagnostics while SL1/Skylar One supplies broader infrastructure, network, business-service, event, and ITSM context.
ScienceLogic publishes a Dynatrace monitoring PowerPack document, and reviewed documentation includes PowerPack versions 100, 105, and 200. Verify current compatibility, supported Dynatrace APIs, authentication, data mapping, and release support before making the integration a procurement requirement.
Best Value

- 【Excellent performance+fanless design】 The Mini PC is powered by a 2.8GHz quad core Pentium Silver J5005 processor and UHD graphics processor. The fanless design ensures complete noise free and maintenance free operation. Faster CPUs can meet your various needs.
- 【4*Intel I226-V】 4 * Intel i226-V network card chip is fully UDE2.5G, with filter connectors, and can be used for servers, monitoring equipment, VPN, monitors, projectors, televisions, etc.
- 【Storage+Memory】Scalable to 2TB (not included) through 2.5-inch SATA HDD/SSD drives. M. 2x4 interface supports expansion of Msat x1 adapter boards, 2 * SO-DIMM DDR4 memory 2400MHz Max 8GB, compatible with 2400/2666/2933/3200MHz
- 【Packaging content+warranty 】 1x fanless mini computer, 1x power adapter, 1xSATA data cable and power cable. We provide lifelong technical support and 12 months of satisfactory service. If there are any problems, please feel free to contact us at any time.
Coexistence is not automatically beneficial. Establish ownership before deployment:
- Which platform is authoritative for application traces and code diagnosis?
- Which platform is authoritative for device health and service-impact events?
- Which platform creates the incident?
- Which alerts are suppressed to prevent duplicates?
- Which topology is used during an incident?
- How are retention, data transfer, integration, and licensing costs controlled?
- Who approves and audits automated remediation?
What proof of concept should you run?
Run the same proof of concept in both products using representative applications and operational incidents. A clean demonstration service will not expose problems with credentials, topology, collectors, agent permissions, legacy systems, or ITSM integration.
- Include one modern microservice application.
- Include one legacy or packaged application.
- Include one database dependency.
- Include one message queue or asynchronous workflow.
- Include one third-party API.
- Include a Kubernetes or container workload.
- Include a network or infrastructure dependency.
- Inject a known slow transaction.
- Perform a failed deployment.
- Simulate a cascading infrastructure incident.
Measure time to the first useful signal, time to identify the affected business service, time to identify the probable root cause, alert count, manual configuration steps, agent or collector resource impact, ITSM integration effort, topology accuracy, dashboard effort, data completeness, and three-year cost under realistic telemetry growth.
Free tools Windows power users keep installed
One-click scans. No signup required.
Require both vendors to demonstrate a slow database call, a memory leak or CPU regression, a network failure affecting an application, a broken deployment, an external dependency failure, a useful ITSM ticket, and an approval-gated remediation workflow.
| PoC scorecard | Evidence to capture |
|---|---|
| Diagnostic depth | Can the platform reach the transaction, service, method, query, process, or device responsible? |
| Operational context | Can the platform identify affected services, owners, dependencies, customers, and business impact? |
| Topology accuracy | Are relationships complete and correct during deployments, failures, scaling events, and short-lived workloads? |
| Noise reduction | How many alerts are generated, grouped, suppressed, or incorrectly correlated? |
| Automation safety | Are approval, rollback, permissions, evidence, and audit requirements satisfied? |
| Cost control | Can the team control ingest, retention, query, trace, session, poll, integration, and storage growth? |
| Adoption | Can developers, NOC analysts, service managers, and executives each complete their required tasks? |
Final recommendation matrix
| Buyer profile | Better starting point | Why |
|---|---|---|
| Developer-led cloud-native organization | Dynatrace | Deep application traces, code-level diagnosis, profiling, and cloud-native dependency visibility |
| Broad NOC and hybrid infrastructure estate | SL1/Skylar One | Discovery, device and infrastructure coverage, service context, events, and operations workflows |
| Need code-level troubleshooting | Dynatrace | Documented Full-Stack tracing, code visibility, CPU profiling, and memory profiling |
| Need discovery across many vendors and devices | SL1/Skylar One | Operations-centric discovery, integrations, topology, and event management |
| Need ITSM and closed-loop workflow automation | SL1/Skylar One | PowerFlow and Run Book Automation align closely with operational orchestration |
| Need deep APM and broad ITOps context | Evaluate both together | Use Dynatrace for application diagnosis and SL1 for wider service and infrastructure operations |
| Price-sensitive small team | Obtain quotes and compare simpler alternatives | Dynatrace consumption needs modeling, while SL1 public list pricing was not found in the reviewed sources |
Frequently Asked Questions
Is ScienceLogic SL1 the same product as Skylar One?
ScienceLogic’s current documentation uses Skylar One for the product formerly known as SL1. Buyers should use both names when searching, but should verify the current release, deployment model, modules, and licensing in the proposal.
Is SL1 a replacement for Dynatrace APM?
SL1 is not automatically a like-for-like replacement for Dynatrace deep APM. SL1 can monitor applications and dependencies, but buyers requiring distributed traces, method-level profiling, and code-level diagnosis must validate those capabilities for their exact applications and integrations.
Is Dynatrace cheaper than ScienceLogic SL1?
There is no supported universal price verdict. Dynatrace publishes consumption-based list-price signals, while public SL1 list pricing was not found in the reviewed official sources. Compare realistic three-year workloads, integrations, retention, deployment, implementation, and staffing costs.
The Tool Desk
Outbyte Driver Updater FREEScan for outdated or missing drivers - takes under a minuteDriver Scan →Outbyte PC Repair FREEClear out junk files and repair common Windows errorsFree Scan →Can Dynatrace and SL1 be used together?
Dynatrace and SL1 can be used together when Dynatrace provides deep application diagnostics and SL1 provides broader infrastructure, service, event, and ITSM context. ScienceLogic publishes Dynatrace PowerPack documentation, but current compatibility and data mapping must be verified before purchase.
Which platform is better for a NOC?
SL1/Skylar One is generally the better starting point for a NOC that needs broad multi-vendor discovery, network and infrastructure monitoring, business-service context, event correlation, and operational automation. Dynatrace may still be added when NOC incidents require deep application traces or code-level evidence.
The Bottom Line
Bottom line: choose Dynatrace when application performance and developer diagnosis are the center of gravity. Choose ScienceLogic SL1—now Skylar One—when hybrid infrastructure, network visibility, service context, event operations, and ITSM automation are the center of gravity. If both problems are material, run a joint proof of concept rather than assuming one platform replaces the other.
Quick Recap
Product prices and availability are accurate as of the date/time indicated and are subject to change. Any price and availability information displayed on Amazon at the time of purchase will apply.

