
Recommended Free Tools
iTechGuides is reader-supported. When you buy through links on our site, we may earn an affiliate commission. As an Amazon Associate I earn from qualifying purchases. Learn more
Zabbix is the best starting point for a technically capable team that wants open-source control and deep customization. PRTG is usually the easier choice for a small or midsize team that wants fast deployment, while Checkmk is especially well suited to large, heterogeneous networks. ManageEngine OpManager and SolarWinds fit traditional commercial network operations; Datadog is the strongest choice when network data must correlate with cloud infrastructure and applications; and Nagios XI remains compelling for on-premises, plugin-heavy, automation-oriented environments.
There is no universal winner. The right tool depends on whether you need classic SNMP-based network management, traffic-flow analysis, application-path troubleshooting, full-stack observability, or a combination of all four. This guide compares those capabilities, deployment models, licensing units, and operational trade-offs so you can compare network monitoring software against your actual environment rather than against a feature-count checklist.
Best network monitoring tools at a glance
| Tool | Best fit | Deployment orientation | Important pricing or design consideration |
|---|---|---|---|
| Zabbix | Open-source monitoring and deep customization | Self-hosted or cloud-managed by the customer | No software license fee, but administration, infrastructure, retention, and support still have costs |
| PRTG Network Monitor | Fast deployment for small and midsize teams | Primarily self-hosted, with a straightforward sensor model | Licensing scales by sensors, not simply by devices |
| Checkmk | Efficient monitoring of heterogeneous infrastructure | Self-hosted and distributed monitoring options | Automatic discovery and rules reduce configuration work; edition differences matter |
| ManageEngine OpManager | Broad commercial NMS for mixed IT operations | Self-hosted and distributed enterprise deployments | Confirm which traffic, application, configuration, firewall, and IPAM features require add-ons |
| SolarWinds Network Performance Monitor | Mature self-hosted operations and path analysis | Self-hosted SolarWinds Observability ecosystem | Package, module, architecture, and quote-based pricing require careful validation |
| Datadog Network Monitoring | Cloud-to-network and full-stack observability | SaaS | Model metric, flow, ingestion, retention, host, and agent costs using real telemetry volumes |
| Nagios XI | On-premises control, plugins, and event-driven automation | Self-hosted | Plugin flexibility is powerful but can require more engineering and maintenance |
The recommendations above are capability-based, not the result of independent performance benchmarks. Your shortlist should be tested with representative devices, alert routes, traffic volumes, retention requirements, and security controls.
What counts as network monitoring?
Traditional network monitoring is primarily about answering four questions:
#1 Best Overall

- 𝗢𝗻𝗲 𝗦𝘄𝗶𝘁𝗰𝗵 𝗠𝗮𝗱𝗲 𝘁𝗼 𝗘𝘅𝗽𝗮𝗻𝗱 𝗡𝗲𝘁𝘄𝗼𝗿𝗸: 5× 10/100/1000Mbps RJ45 Ports supporting Auto Negotiation and Auto MDI/MDIX.
- 𝗚𝗶𝗴𝗮𝗯𝗶𝘁 𝘁𝗵𝗮𝘁 𝗦𝗮𝘃𝗲𝘀 𝗘𝗻𝗲𝗿𝗴𝘆: Latest innovative energy-efficient technology greatly expands your network capacity with much less power consumption and helps save money.
- 𝗥𝗲𝗹𝗶𝗮𝗯𝗹𝗲 𝗮𝗻𝗱 𝗤𝘂𝗶𝗲𝘁: IEEE 802.3X flow control provides reliable data transfer and Fanless design ensures quiet operation.
- 𝗣𝗹𝘂𝗴 𝗮𝗻𝗱 𝗣𝗹𝗮𝘆: Easy setup with no software installation or configuration needed.
- 𝗔𝗱𝘃𝗮𝗻𝗰𝗲𝗱 𝗦𝗼𝗳𝘁𝘄𝗮𝗿𝗲 𝗙𝗲𝗮𝘁𝘂𝗿𝗲𝘀: Prioritize your traffic and guarantee high quality of video or voice data transmission with Port-based 802.1p/DSCP QoS and IGMP Snooping.
- Is the device, interface, circuit, or service available?
- Is it operating within acceptable performance limits?
- What changed or failed?
- Who needs to be notified, and what should happen next?
A conventional network-management system typically polls devices with SNMP, collects interface counters, checks CPU and memory, processes traps, discovers equipment, displays maps, stores historical data, and raises alerts. That is enough for many campus, branch, data-center, and WAN environments.
Modern observability platforms go further. They correlate network traffic with hosts, containers, cloud services, applications, logs, traces, and user-facing paths. That makes them more useful when the question is not simply whether a switch is up, but why a customer request is slow or why an application cannot reach a dependency across several network hops.
These categories overlap, but they are not interchangeable. A tool can be excellent at SNMP polling without providing application tracing. Conversely, a full-stack observability platform may provide superb correlation while being more expensive or less convenient for a traditional network team that mainly needs interface health and device alerts.
Telemetry types you should distinguish
| Telemetry | What it tells you | When it matters |
|---|---|---|
| SNMP polling | Periodic values such as uptime, interface utilization, errors, discards, CPU, memory, temperature, and power status | Baseline availability and performance monitoring |
| SNMP traps | Device-generated events, such as link changes, hardware alarms, or authentication events | Faster event notification, provided traps are configured reliably and correlated with polled data |
| Flow telemetry | Top talkers, source and destination relationships, applications or protocols, traffic direction, and volume | Capacity planning, traffic investigation, and finding who is consuming a link |
| Syslog | Text-based device and security events | Change investigation, fault context, and event correlation |
| Active path tests | Reachability and latency across intermediate hops between a probe and a destination | Separating a local device problem from a WAN, cloud, provider, or application-path problem |
| APIs and agents | Cloud, controller, application, host, container, and platform-specific data | Environments where SNMP alone cannot explain application or cloud behavior |
SNMP polling is sufficient for many network-health questions. Add traps when event-driven notifications are important, flow data when you need traffic composition rather than interface counters, and active path or application telemetry when users experience connectivity or performance problems.
1. Zabbix: best open-source and customization-first option
Zabbix is the strongest general recommendation for a technically capable organization that wants broad monitoring without a software license fee. It is an enterprise-class open-source distributed platform that can monitor network devices alongside servers, virtual machines, applications, databases, cloud services, websites, and containers. Teams that want to try Zabbix should understand that the low license cost does not eliminate the need for platform ownership.
For network monitoring, Zabbix supports SNMP versions 1, 2c, and 3, as well as SNMP traps, availability and performance checks, network discovery, flexible triggers, escalation workflows, dashboards, maps, historical data, templates, API access, and distributed proxies. Proxies are useful when monitoring remote sites or when the central server should not directly reach every device.
The main advantage is control. Administrators can build templates, triggers, dependencies, escalation paths, dashboards, and automation around the organization’s exact operating model. Zabbix can therefore grow from a home lab or nonprofit deployment into a broader infrastructure-monitoring system without forcing the team into a narrow device-only model.
Crashes, No Sound, or Screen Glitches?
Random freezes, missing sound and display glitches usually trace back to one bad driver. Find and replace yours safely.Free scan · under a minutePC Slower Than It Used to Be?
A free scan shows the junk files, broken settings and background clutter dragging Windows down - then fixes them in one click.Free scan · Windows 10 & 11The trade-off is configuration responsibility. Flexibility creates decisions about template governance, naming, discovery rules, retention, upgrades, permissions, alert thresholds, and automation safety. A Zabbix deployment can become noisy or difficult to maintain if every administrator creates slightly different checks and triggers. Budget for administration, storage, backups, upgrades, and possibly commercial support.
Zabbix has been released under AGPLv3 from version 7.0 onward; older releases remain under GPLv2 or later. Verify the license and support implications for the specific version and distribution you plan to deploy.
Choose Zabbix if: you have Linux or infrastructure expertise, want to retain control of monitoring data, need extensive customization, or want one platform for networks and other infrastructure.
Look elsewhere first if: your priority is the quickest possible deployment with minimal platform administration or a fully managed SaaS experience.
What’s actually slowing this PC down?
Pick the symptom - the matching free tool is one click away.
2. PRTG Network Monitor: best practical all-rounder for fast deployment
For a small or midsize IT team seeking a recognizable interface and broad built-in checks, PRTG Network Monitor is one of the most practical starting points. Its sensor-based design covers systems, devices, traffic, and applications through methods including SNMP, WMI, Windows performance counters, SSH, flow protocols, packet sniffing, HTTP requests, REST APIs, ping, SQL, and notifications. It also provides maps, dashboards, and mobile applications.
PRTG’s appeal is that a new deployment can move quickly from device discovery to useful dashboards and alerts. It can monitor more than network interfaces, which is helpful when a small team wants one product to cover servers, applications, web endpoints, and network equipment.
The important caveat is the sensor model. The freeware edition supports up to 100 sensors after the trial period, and paid licensing scales by sensor count. A single device may consume sensors for availability, interfaces, CPU, memory, disk, services, traffic, or application checks. Two organizations with the same number of network devices can therefore have very different licensing requirements.
Rank #2
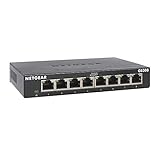
- GIGABIT ETHERNET PORTS: Features 8 x 1.0Gbps Ethernet ports for high-speed connectivity. Auto-negotiating ports detect the optimal speed for connected devices and work with existing Cat5e or Cat6 Ethernet cables.
- PLUG-AND-PLAY UNMANAGED NETWORK SWITCH: Simple plug-and-play setup with no software to install or configuration required.
- FLEXIBLE MOUNTING OPTIONS: Compact metal design supports desktop or wall-mount placement for versatile installation.
- SILENT & ENERGY-EFFICIENT OPERATION: Fanless design ensures silent performance, while IEEE 802.3az Energy Efficient Ethernet reduces power consumption without compromising high-speed network performance.
- REGIONAL COMPATIBILITY: Made for use in U.S. & CA only
Before buying, create an inventory that estimates sensors per device type and per critical service. Include growth, redundant links, wireless controllers, VPNs, WAN circuits, and non-network checks. Do not compare a sensor-based license with a node-based license until you have translated your environment into the relevant unit.
Choose PRTG if: you want broad monitoring methods, a relatively quick path to deployment, and a product that can serve a mixed Windows, network, and application environment.
Look elsewhere first if: the sensor count will grow unpredictably or your team prefers a rules-based, automatically discovered model at large scale.
3. Checkmk: best for efficient heterogeneous infrastructure monitoring
Checkmk network monitoring is particularly attractive for teams managing many vendors, interfaces, and infrastructure types. Its design emphasizes automatic discovery and a rules-based configuration model instead of requiring administrators to configure every metric independently.
Its network coverage includes switches, routers, wireless infrastructure, firewalls, port status, packet and error rates, bandwidth, CPU, memory, fans, power supplies, temperature, VPNs, and routing-related metrics. Checkmk states that it includes more than 2,000 preconfigured checks, which can reduce the effort required to build a useful baseline across a varied estate.
The rules-based model is valuable when a network contains recurring patterns. An administrator can apply monitoring behavior by host group, device type, site, interface pattern, or other organizational rule rather than maintaining every object separately. Distributed monitoring can extend the design to multiple locations.
Flow visibility is available through integration with ntopng, supporting NetFlow, sFlow, and IPFIX. That distinction matters: ordinary network monitoring can tell you that a link is heavily used, while flow analysis can help identify the sources, destinations, protocols, or traffic relationships responsible.
Checkmk’s principal trade-off is that buyers need to understand its editions and deployment choices. Advanced flow monitoring follows an add-on or integration path, and the most suitable feature set may differ by edition. Confirm the exact capabilities, support model, and licensing terms before standardizing on it.
Choose Checkmk if: you have a large or varied device estate, value automatic discovery, want efficient rules, and need strong infrastructure coverage with historical trends.
Do these 3 things before closing this tab:
1Clear out junk files and repair common Windows errors2Fix the driver behind crashes, sound loss and screen glitches3Repair Windows errors before they cause bigger problemsLook elsewhere first if: you want an entirely managed SaaS platform or prefer a simpler sensor-based commercial purchase model.
4. ManageEngine OpManager: best broad commercial NMS for mixed IT operations
ManageEngine OpManager is a broad commercial network-management system for organizations that want network monitoring alongside several adjacent operations functions. Its documented capabilities include automatic discovery, topology mapping, switch-port mapping, router and switch monitoring, WAN round-trip-time monitoring using Cisco IP SLA, VoIP monitoring, syslog and SNMP-trap processing, dashboards, reporting, workflow automation, and distributed monitoring.
OpManager supports SNMP, WMI, CLI, and flow-based traffic monitoring. Its wider product family and integrations can extend into traffic analysis, configuration management, firewall logs, application performance, and IP address management. This breadth can be useful when the network team needs to connect fault management with configuration, application, or address-management workflows instead of maintaining several isolated tools.
ManageEngine describes enterprise deployments exceeding 10,000 devices or 50,000 interfaces. That is a vendor-stated scale reference, not an independent performance benchmark; a proof of concept should still test polling intervals, discovery, database growth, dashboard responsiveness, and alert throughput in your environment.
The Tool Desk
Outbyte PC Repair FREEClear out junk files and repair common Windows errorsFree Scan →Outbyte Driver Updater FREEFix the driver behind crashes, sound loss and screen glitchesFind Drivers →The main risk is product complexity. Broad functionality can lead to multiple editions, modules, and add-on decisions. Ask specifically whether traffic analysis, configuration management, firewall-log monitoring, application monitoring, IPAM, and advanced workflow features are included in the package under consideration.
Rank #3

- GIGABIT ETHERNET PORTS: Features 5 x 1.0Gbps Ethernet ports for high-speed connectivity. Auto-negotiating ports detect the optimal speed for connected devices and work with existing Cat5e or Cat6 Ethernet cables.
- PLUG-AND-PLAY UNMANAGED NETWORK SWITCH: Simple plug-and-play setup with no software to install or configuration required.
- FLEXIBLE MOUNTING OPTIONS: Compact metal design supports desktop or wall-mount placement for versatile installation.
- SILENT & ENERGY-EFFICIENT OPERATION: Fanless design ensures silent performance, while IEEE 802.3az Energy Efficient Ethernet reduces power consumption without compromising high-speed network performance.
- REGIONAL COMPATIBILITY: Made for use in U.S. & CA only
Choose ManageEngine OpManager if: you want a commercial NMS with mapping, reporting, WAN and VoIP visibility, workflows, and a broad path into mixed IT operations.
Look elsewhere first if: you want a narrowly focused network tool, a minimal operational footprint, or a single transparent SaaS bill based on telemetry.
5. SolarWinds Network Performance Monitor: best mature self-hosted path-analysis ecosystem
SolarWinds Network Performance Monitor is positioned within SolarWinds Observability Self-Hosted and is also described in relation to standalone Orion modules. It is a strong candidate for established IT organizations that need mature network-operations workflows, self-hosted control, and a broader product ecosystem.
Quick wins for a faster PC:
Fix the driver behind crashes, sound loss and screen glitchesFind Drivers →Clear out junk files and repair common Windows errorsFree Scan →The self-hosted ecosystem can include network performance, flow monitoring, configuration management, IP address management, user and device tracking, server and application management, virtualization, logs, and VoIP or call-quality management. This modular approach can suit an organization that wants to begin with network performance and add related operational capabilities over time.
Its distinctive path-troubleshooting capability is NetPath. NetPath provides hop-by-hop visibility into critical paths across on-premises and cloud environments, including latency and the node or link associated with a slowdown. That addresses a different question from ordinary interface polling: not merely whether a router is responding, but where a user or application path is degrading.
The trade-off is commercial and architectural complexity. The current self-hosted offering is quote-based, and the product family may involve multiple modules. Validate the precise package, deployment architecture, licensing metric, support terms, database requirements, and whether NetPath and other desired capabilities are included or separately licensed.
Choose SolarWinds NetPath when path analysis and a mature self-hosted network-operations ecosystem are central requirements.
Look elsewhere first if: you need a very lightweight deployment, fully transparent pricing, or a cloud-native observability platform without a larger modular estate.
6. Datadog Network Monitoring: best for cloud-to-network observability correlation
Datadog Network Device Monitoring is the best fit on this list for a cloud-native or hybrid organization that wants network data correlated with applications, infrastructure, containers, and cloud services. It is a SaaS-oriented observability platform rather than a narrowly focused traditional NMS.
Datadog’s network capabilities include device discovery and metrics through SNMP, SNMP traps, APIs, NetFlow, and syslogs. Its broader network monitoring can provide topology maps, vendor profiles, device metrics, flow analysis, hop-by-hop path views, anomaly alerts, and correlation between traffic and the infrastructure or applications responsible for it.
This correlation is the core reason to choose Datadog. A traditional NMS might show an overloaded interface, while a full-stack observability platform can help connect that traffic to a host, service, cloud resource, or application behavior. That can reduce the time spent moving between separate network, infrastructure, and application consoles.
Free tools Windows power users keep installed
One-click scans. No signup required.
The cost model requires more careful forecasting than a simple device count. Assess ingestion, metric, flow, retention, host, and agent costs using your own number of devices, interfaces, flows, sites, hosts, containers, and data-retention periods. A platform that is economical for a cloud-first environment may be less attractive if you only need basic SNMP polling for a large number of low-change devices.
Choose Datadog Network Device Monitoring if: your organization already uses Datadog, operates across multiple clouds or hybrid infrastructure, and needs network-to-application correlation.
Look elsewhere first if: you mainly need classic NMS functions, want to keep all monitoring infrastructure on premises, or cannot justify telemetry-based SaaS costs.
Rank #4

- 8 GIGABIT PORTS: Features 8 RJ45 ports supporting 10/100/1000 Mbps speeds, providing high-speed wired network connectivity for computers, printers, gaming consoles, and other Ethernet-enabled devices
- PLUG AND PLAY SETUP: No configuration required; simply connect the switch to your network devices and it is ready to use immediately, making network expansion quick and hassle-free
- FANLESS QUIET DESIGN: The fanless design ensures silent operation, making this switch suitable for noise-sensitive environments such as home offices, bedrooms, or conference rooms
- STURDY METAL CONSTRUCTION: Built with a durable metal housing and shielded ports that provide reliable performance, better heat dissipation, and protection against electromagnetic interference
- TRAFFIC OPTIMIZATION: Supports IEEE 802.3x flow control and advanced traffic optimization technology to reduce data bottlenecks and ensure smooth, efficient data transfer across your network
7. Nagios XI: best for on-premises control, extensibility, and automation
Nagios XI is a strong choice for teams that prioritize local control, broad plugin extensibility, custom event handling, and automation. It monitors routers, switches, firewalls, servers, cloud workloads, applications, and services, with capabilities including SNMP-based monitoring, topology maps, alerting, escalation, capacity planning, SLA reporting, custom actions, remediation scripts, Ansible playbooks, distributed monitoring, and integrations.
What’s actually slowing this PC down?
Pick the symptom - the matching free tool is one click away.
The plugin-oriented ecosystem is its defining strength. Nagios advertises more than 5,000 plugins across its ecosystem, allowing teams to extend monitoring beyond the checks supplied by the core product. Event handlers and custom actions can connect alerts to remediation scripts or Ansible playbooks, although automated remediation should be introduced carefully and tested against failure scenarios.
Nagios also advertises perpetual-license editions. Its published starting prices at the time of the supplied research were $2,595 for Standard and $4,690 for Enterprise for 100 nodes. These figures are volatile and should be rechecked directly before purchase; they should not be treated as a current quote or a complete cost estimate.
The trade-off is engineering effort. Plugins provide flexibility, but teams may need to maintain scripts, validate compatibility, govern custom checks, tune thresholds, and document ownership. Compared with highly automated SaaS platforms, Nagios may demand more operational design from the customer.
Choose Nagios XI if: on-premises data control, custom checks, event-driven automation, and perpetual-license options are more important than a highly managed experience.
Recommended Free Tools
Look elsewhere first if: you want automatic discovery and extensive preconfigured coverage with minimal custom engineering.
Independent reader supportYour contribution helps us test, update, and keep practical guides available for everyone.How to choose the right tool
1. Choose the deployment model first
Deployment eliminates some options before feature comparisons begin:
- SaaS and full-stack observability: start with Datadog if applications, hosts, containers, cloud services, and network devices must appear in one observability workflow.
- Self-hosted control: evaluate Zabbix, Checkmk, Nagios XI, PRTG, ManageEngine OpManager, and SolarWinds.
- Distributed or hybrid operations: confirm how collectors, proxies, remote probes, firewalls, upgrades, and data transport work across sites.
Do not treat self-hosted as free. It shifts responsibility for servers, databases, storage, backups, security hardening, patching, availability, and upgrades to your team.
2. Define the telemetry you actually need
Write down the questions the monitoring system must answer. If the list only includes device availability, interface utilization, errors, CPU, memory, and temperature, SNMP polling may be enough. If you need immediate hardware and link events, add traps. If you need top talkers, traffic direction, protocols, or application traffic, require flow support. If the complaint is slow access to a cloud or hosted application, require active path analysis or application-to-network correlation.
Flow support also needs qualification. NetFlow, sFlow, and IPFIX are related but not identical, and device support varies by vendor and model. Confirm whether collection, storage, visualization, and analysis are built in or require a separate product or integration.
3. Inventory the billable monitoring unit
Pricing models are not directly comparable:
- Sensor: PRTG counts individual checks, so one device can consume many sensors.
- Node or device: Nagios and some commercial tools may center pricing on monitored nodes, but included capabilities still need confirmation.
- Interface: Some plans or modules may count interfaces, which can matter greatly for switches and routers.
- Metric, host, agent, flow, ingestion, or retention: SaaS observability costs can depend on telemetry volume and how long it is retained.
- Module or edition: Commercial NMS products may require separate components for traffic, configuration, IPAM, logs, or application monitoring.
Build a spreadsheet with devices by type, interfaces, services, sites, flows, polling intervals, expected growth, and retention. Price the spreadsheet—not an abstract device count.
4. Evaluate alert operations, not just dashboards
A monitoring platform is useful only if it turns telemetry into manageable work. Test whether it supports:
- Dependencies that suppress downstream alarms when an upstream device or circuit fails
- Maintenance windows and planned-change suppression
- Escalation schedules and on-call routing
- Deduplication and alert grouping
- Thresholds, baselines, anomaly detection, and hysteresis
- Role-based dashboards and permissions
- Ticketing, messaging, email, webhook, or other notification integrations
- Auditable remediation actions and safe rollback
Ask to see what happens during a realistic outage. A product that generates hundreds of independent alarms for one failed WAN circuit may be technically capable but operationally poor.
5. Check vendor depth against the actual estate
Generic SNMP support does not guarantee useful monitoring. A vendor profile, template, or controller integration may be required for wireless metrics, firewall state, VPN tunnels, routing protocols, power supplies, environmental sensors, virtual chassis, or proprietary hardware data.
Best Value
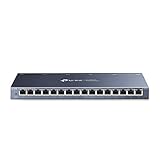
- One Switch Made to Expand Network-16× 10/100/1000Mbps RJ45 Ports supporting Auto Negotiation and Auto MDI/MDIX
- Gigabit that Saves Energy-Latest innovative energy-efficient technology greatly expands your network capacity with much less power consumption and helps save money
- Reliable and Quiet-IEEE 802.3X flow control provides reliable data transfer and Fanless design ensures quiet operation
- Plug and Play-Easy setup with no software installation or configuration needed
- Advanced Software Features-Prioritize your traffic and guarantee high quality of video or voice data transmission with Port-based 802.1p/DSCP QoS and IGMP Snooping
Make a list of the exact device families and firmware versions in use. Test the most important and least common platforms, not only a familiar switch. Also confirm whether SNMPv3 authentication and privacy, trap reception, API credentials, and collector placement meet your security requirements.
Proof-of-concept checklist
Run a short proof of concept with at least one representative device from every important category. A useful evaluation should include:
- Discovery: add a switch, router, firewall, wireless device, WAN endpoint, and server or application endpoint. Check how much manual cleanup is needed.
- Credentials and security: test SNMPv3 where available, least-privilege accounts, encrypted transport, collector placement, and firewall rules.
- Baseline metrics: verify interface status, utilization, errors, discards, CPU, memory, temperature, power, and uptime.
- Event handling: generate or simulate an interface-down event, a threshold breach, and an SNMP trap. Confirm the alert text, delay, deduplication, dependency handling, and recovery notification.
- Flow analysis: send NetFlow, sFlow, or IPFIX from a supported device if top-talkers and traffic composition matter.
- Path troubleshooting: test a branch-to-cloud or user-to-application path if WAN or application performance is a requirement.
- Operations: create a maintenance window, change a threshold, acknowledge an alert, escalate an unacknowledged alert, and export a report.
- Scale: estimate database growth, polling load, flow volume, dashboard response, and alert throughput at the expected production inventory.
- Recovery: test backup, restore, collector failure, network isolation, upgrade procedure, and loss of connectivity to the central system.
Record the number of manual steps, false positives, time to diagnose a simulated incident, and effort required to add a second site. These results are more meaningful than a vendor’s maximum device count.
The Tool Desk
Outbyte Driver Updater FREEFix the driver behind crashes, sound loss and screen glitchesFind Drivers →Outbyte PC Repair FREERepair Windows errors before they cause bigger problemsFix Now →Best tool by buyer profile
| Buyer profile | Best starting point | Reason |
|---|---|---|
| Home lab, nonprofit, or budget-constrained technical team | Zabbix | Open-source licensing, broad protocol support, discovery, templates, and automation |
| Small or midsize team wanting fast setup | PRTG | Broad built-in monitoring methods and an understandable sensor model |
| Heterogeneous network with many ports and vendors | Checkmk | Automatic discovery, rules-based configuration, and broad preconfigured checks |
| Mixed network, server, VoIP, and WAN operations | ManageEngine OpManager | Mapping, reporting, workflows, WAN RTT, VoIP, and adjacent modules |
| Mature enterprise network operations with path troubleshooting | SolarWinds NPM | NetPath and an extensive self-hosted network-operations ecosystem |
| Cloud-native or hybrid full-stack observability | Datadog | Correlation across applications, infrastructure, cloud, flows, and devices |
| On-premises, plugin-heavy, automation-oriented operations | Nagios XI | Local control, extensibility, event handlers, and perpetual-license options |
What about Amazon, AWS Marketplace, and physical network tools?
The central products in this comparison are software platforms or hosted services, not physical products normally purchased through Amazon retail. Network cable testers and link testers can be useful for diagnosing a bad cable, connector, port, or physical link, but they do not continuously poll devices, retain performance history, correlate alerts, or provide network-wide monitoring. They should not be presented as substitutes for a network-management system.
AWS users may find deployable monitoring software through network monitoring on AWS Marketplace, including software images or comparable monitoring AMIs. That is a cloud procurement and deployment route, not the same thing as buying a physical product from Amazon retail. Check the current marketplace listing, AWS infrastructure costs, software licensing, support terms, and deployment requirements before choosing that path.
There is no honest Amazon physical-product recommendation for this article’s main buying decision. A cable tester, generic Ethernet tool, or unrelated book would solve a different problem and could mislead readers.
Final buying advice
Start with the operational question, not the brand. For basic device and interface health, choose the platform whose discovery, templates, alerting, and licensing model your team can maintain. For traffic investigation, require flow support. For user-facing connectivity problems, require path analysis. For cloud and application correlation, consider a full-stack observability platform.
For most buyers, the first shortlist should be Zabbix, PRTG, and Checkmk for different levels of customization and deployment efficiency; ManageEngine OpManager or SolarWinds for broad commercial network operations; Datadog for cloud-to-application correlation; and Nagios XI for plugin-driven on-premises automation. Put two or three through the same proof of concept, price the real monitoring inventory, and select the one that produces actionable alerts without creating an unmanageable administration burden.
Frequently Asked Questions
Is SNMP enough for network monitoring?
SNMP polling is enough for many availability, interface, error, utilization, CPU, memory, and environmental checks. Add SNMP traps for device-generated events, flow telemetry for traffic composition and top talkers, and active path or application telemetry when you need to explain user-facing connectivity or latency.
What is the difference between PRTG sensors and monitored devices?
A PRTG sensor is an individual check, not necessarily an entire device. One switch may use separate sensors for availability, interfaces, CPU, memory, errors, and other services. Estimate sensors per device and include growth before comparing PRTG with node-, interface-, or telemetry-based licenses.
Which network monitoring tool is best for a home lab?
Zabbix is the strongest starting point when you are comfortable administering the platform and want open-source control. PRTG can also be suitable for a small installation because its freeware edition supports up to 100 sensors after the trial period, but the sensor model becomes important as the lab grows.
Quick wins for a faster PC:
Clear out junk files and repair common Windows errorsFree Scan →Scan for outdated or missing drivers - takes under a minuteDriver Scan →Can a traditional network-monitoring system monitor applications too?
Several tools in this comparison extend beyond network devices. Zabbix, PRTG, ManageEngine OpManager, SolarWinds, Datadog, and Nagios can monitor various servers, applications, services, or cloud workloads. However, application monitoring depth and network-to-application correlation vary substantially, so test the specific technologies your organization uses.
Are free or open-source network monitoring tools really free?
They may have no software license fee, but they still require compute, storage, backups, upgrades, security maintenance, configuration work, alert tuning, and staff time. Zabbix is the clearest open-source choice in this comparison, but its flexibility makes governance and administration part of the total cost.
The Bottom Line
Bottom line: choose Zabbix for open-source control, PRTG for fast practical deployment, Checkmk for heterogeneous infrastructure, ManageEngine OpManager for broad commercial NMS coverage, SolarWinds for mature self-hosted path analysis, Datadog for cloud-to-network correlation, and Nagios XI for on-premises plugins and automation. Validate the choice with a representative proof of concept and price the monitoring units your environment will actually consume.
Quick Recap
Product prices and availability are accurate as of the date/time indicated and are subject to change. Any price and availability information displayed on Amazon at the time of purchase will apply.

