
What’s actually slowing this PC down?
Pick the symptom - the matching free tool is one click away.
Access logs show what happened to individual requests: when they arrived, what was requested, whether they succeeded, and—if your logging format includes timing fields—how long they took. Use them to find which routes, upstreams, response types, or client groups concentrate slow requests, then correlate those records with application and infrastructure evidence. A slow-request pattern is a lead to investigate, not proof of its cause.
What access logs can—and cannot—tell you
An access log is request-level evidence. Apache’s Common Log Format example records the client address, timestamp, request line, status code, and response bytes. Those fields help answer who requested what, when, and with what outcome; they do not, by themselves, explain how much time the request spent waiting on an application or database.

For latency analysis, the format must include request-duration fields. A reverse proxy such as NGINX can also record upstream timing, which helps separate time spent establishing a connection from time spent waiting for a response. If your current log format omits these fields, you may not be able to reconstruct that detail for past requests.
Logs are most useful alongside application, database, load-balancer, and infrastructure records. AWS Prescriptive Guidance notes that logs support both root-cause analysis and correlation between system components. A request ID is helpful when services propagate one; otherwise, align timestamps and other available identifiers, allowing for the fact that clocks and log formats may differ.
#1 Best Overall

- FMCSA & DOT ELD MANDATE COMPLIANT — Stay road-legal and avoid roadside fines or out-of-service orders. My20 ELD meets 100% of federal Hours-of-Service logging requirements for trucks of every size, from owner-operators to full fleets. **not Canadian certified**
- ONE OF THE MOST AFFORDABLE ELDs ON THE MARKET — $149.99 hardware, no proprietary box. Requires a My20 ELD subscription starting at $25/month, billed annually — see exact pricing in the listing details below before you order.
- SIMPLE PLUG-AND-PLAY INSTALL — Connects to your truck's standard 9-pin (J1939) diagnostic port in minutes; 6-pin (J1708) and OBD-II adapter cables available for other setups. Just add the free My20 ELD app and pair via Bluetooth.
- GPS TRACKING, DVIR, IFTA & MORE — Built by trucking-industry veterans with 100+ years of combined experience, My20 ELD gives owner-operators and small fleets the same tools as a full TMS, right from your phone.
- REAL SUPPORT WHEN YOU NEED IT — New to ELDs? Our support team walks you through account setup and pairing step-by-step, and most setup questions are resolved on the first call.
Which fields help locate a delay?
Check that your access-log format captures the fields needed to answer the questions you expect to ask. The right set depends on your server and architecture.
| Field | What it helps you investigate |
|---|---|
| Timestamp | Which time window contains the slowdown, and whether it aligns with a deployment or other event. |
| Method and path | Whether slow requests cluster around a particular route or type of operation. |
| Status code | Whether slow requests end in success, a client error, or a server error. |
| Response bytes | Whether larger responses are associated with longer request times. |
| Request duration | How long the server or proxy took to handle each request, as defined by that platform’s timing field. |
| Upstream target and timing | Whether requests sent to an application server or other upstream show a different delay pattern. |
| Request ID, client, or region | Whether a request can be joined to other service logs or whether a client group or location is affected. |
Read NGINX timing fields as a sequence
NGINX’s documented access-log example uses $request_time (rt in the example), $upstream_connect_time (uct), $upstream_header_time (uht), and $upstream_response_time (urt). Read these together rather than treating one number as a complete explanation: request time describes the full request duration, while the upstream fields show timing around connecting to the upstream and receiving its response.
Rank #2
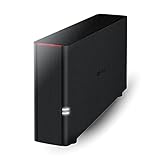
- Value NAS with RAID for centralized storage and backup for all your devices. Check out the LS 700 for enhanced features, cloud capabilities, macOS 26, and up to 7x faster performance than the LS 200.
- Connect the LinkStation to your router and enjoy shared network storage for your devices. The NAS is compatible with Windows and macOS*, and Buffalo's US-based support is on-hand 24/7 for installation walkthroughs. *Only for macOS 15 (Sequoia) and earlier. For macOS 26, check out our LS 700 series.
- Subscription-Free Personal Cloud – Store, back up, and manage all your videos, music, and photos and access them anytime without paying any monthly fees.
- Storage Purpose-Built for Data Security – A NAS designed to keep your data safe, the LS200 features a closed system to reduce vulnerabilities from 3rd party apps and SSL encryption for secure file transfers.
- Back Up Multiple Computers & Devices – NAS Navigator management utility and PC backup software included. NAS Navigator 2 for macOS 15 and earlier. You can set up automated backups of data on your computers.
NGINX can emit multiple upstream values separated by commas, and internal redirects are represented with semicolons. A zero or hyphen can have a specific meaning when an upstream cannot be reached or a cache/error path is involved; do not treat those values as ordinary measured durations. Interpret them using the NGINX logging documentation and the request path through your configuration.
Check IIS fields before an incident
Microsoft’s LogParser walkthrough is intended to help identify causes of IIS performance issues or application errors. Microsoft highlights Bytes Sent and Bytes Received as useful troubleshooting fields and notes that they are not enabled by default. Confirm that the fields you need are being collected before a performance incident; enabling them afterward will not add detail to existing log records.
The Tool Desk
Outbyte PC Repair FREERepair Windows errors before they cause bigger problemsFix Now →Outbyte Driver Updater FREEFix the driver behind crashes, sound loss and screen glitchesFind Drivers →Rank #3

- MOST POWERFUL AND AFFORDABLE ELD solution on the market. Fits fleets of any size.
- Monthly Subscription Required (No Contract)
- Tracking, telematics, ELD service, IFTA and much more included with monthly subscription
- EASY TO USE: Installation and setup can be done in under 5 minutes.
- Connects directly to 9 pin port. If necessary adapter cables may be purchased separately
How to investigate a slow-request incident
- Define the symptom and window. Start with a measurable signal such as elevated p95 or p99 latency, a timeout increase, a 5xx spike, a slow route, or reports from a particular region. Record the affected time range and any known deployment or configuration changes.
- Verify the available fields. Confirm that logs include timestamps, method, path, status, bytes, and request duration. For proxied traffic, check for upstream timing and target identifiers; for IIS, verify that useful fields such as Bytes Sent and Bytes Received were enabled.
- Filter to the incident window and inspect the tail. Rank requests by duration and compare the distribution with a suitable unaffected period. Pay attention to high-percentile latency and the slowest requests, not just the average: a small number of very slow requests can disappear inside an average.
- Group the slow records. Break them down by route, method, status, upstream target, response size, client or region, and—if recorded—deployment version. A concentration in one route or target is a more specific investigation lead than a broad increase across the service.
- Correlate across components. Use request identifiers where available; otherwise, search application, database, load-balancer, and infrastructure logs around the matching timestamps. A searchable backend with filtering, aggregation, and visualization makes it easier to compare records across services.
- Validate the suspected cause. Check the pattern against an application metric, a controlled trace, or a before-and-after comparison. A slow request associated with a particular upstream or response size does not alone establish that the upstream or payload caused the delay.
- Preserve useful evidence and limit overhead. Rotate and archive logs, analyze rotated files offline where practical, and use debug-level verbosity in production only for a bounded diagnostic window with a clear reason.
How to use logs on Apache, NGINX, and IIS
Apache HTTP Server
Apache uses LogFormat to define logged fields and CustomLog to write access logs. Its Common Log Format example includes client IP, timestamp, request, status, and response bytes. That is a useful request history, but it does not include a request-duration field in the example; ensure your configured format contains the timing information required for latency analysis.
Apache recommends log rotation and advises against running periodic analysis against a file that is actively being written. Its Performance Scaling guidance also recommends placing disk-based site content on a different physical disk from server log files because their access patterns differ. Apply that advice in the context of your storage and deployment design rather than assuming all servers have separate physical disks available.
Rank #4

- Most compact LTE router in its class supporting 150Mbps/50Mbps (DL/UL)
- Power-over-Ethernet— Powered Device capability, ideal for fixed low power applications
- Supports edge processing and IoT applications with ALEOS Application Framework (AAF)
- Remote, secure network management in the cloud or in the enterprise
- Includes first year of network management and support with AirLink Complete
NGINX
NGINX’s access-log example demonstrates how to add request and upstream timing values. If you use a custom format, verify that it captures the fields you need and that your analysis understands multiple upstream attempts and internal redirects. A comma-separated sequence or a zero/hyphen value may describe a request path or failure condition, not a single ordinary timing measurement.
IIS
For IIS, Microsoft’s documented workflow uses LogParser to analyze IIS logs for performance issues or application errors. Before an incident, check the logging configuration for the fields your investigation may need, particularly Bytes Sent and Bytes Received. Then use LogParser to filter and compare records for the relevant window, routes, and status codes.
Free tools Windows power users keep installed
One-click scans. No signup required.
Choosing where to search and retain logs
The right approach depends on how much data you need to query, how quickly you need results, and whether you must correlate records across multiple services. Raw files can be sufficient for a focused investigation; searchable or managed systems can make repeated filtering and aggregation more practical. Whichever approach you choose, account for retention, access controls, redaction needs, cost, delivery completeness, and the operational work of running the system.
| Approach | Useful when | Trade-offs to assess |
|---|---|---|
| Rotated raw log files | You need a straightforward record of requests or occasional offline analysis. | Searching and aggregation can become cumbersome as files and services multiply. Keep rotation and archiving in place, and avoid analyzing a file while it is actively being written. |
| Self-managed searchable backend | You need parsing, filtering, aggregation, correlation, or visualization across services and want to manage the stack yourself. | Plan for storage, processing, buffering, access controls, retention, and ongoing operational work. |
| Managed log or observability service | You want hosted search and analysis capabilities rather than operating the whole backend. | Evaluate ingestion and retention costs, access controls, redaction, query capabilities, and the service’s delivery characteristics. Managed storage does not make every source log complete or immediate. |
AWS recommends a scalable backend that supports parsing, filtering, buffering, correlation, and visualization. Its guidance gives seven days as an example minimum retention period for searching logs during performance testing; this is operational guidance for that use case, not a universal retention requirement.
S3 server-access logs have an important limitation: AWS describes delivery as best effort. Logs are usually delivered within a few hours, but may be delayed, missing, or duplicated. Use them for operational analysis with those limits in mind, not as a complete, real-time accounting of every request.
Can access logging slow down a server?
Logging has costs: requests generate data that must be written, retained, and, if analyzed, processed. AWS warns that excessive logging can negatively affect performance and increase storage and processing costs. Apache likewise emphasizes managing log files and their impact on server storage and performance.
Keep the records that help answer operational questions, rotate and archive them, and prefer offline analysis of rotated files when it suits the task. Avoid leaving highly verbose diagnostic logging enabled indefinitely. If you need a temporary increase in detail, bound it to a defined diagnostic window and account for the additional data and processing.
Quick Recap
Common interpretation mistakes
- Relying on averages alone: averages can hide a small but important group of slow requests; inspect the distribution and tail.
- Assuming a correlation proves a cause: a route, client, or upstream can be associated with slow requests without being the underlying cause. Validate with another signal or controlled comparison.
- Expecting fields that were never collected: logs cannot recover historical timings or byte counts omitted from the configured format.
- Reading upstream timing as one simple value: NGINX may record multiple upstream values or special zero/hyphen values; interpret them in the context of retries, redirects, and cache/error handling.
- Treating cloud-delivered logs as complete and immediate: S3 server-access logging is best effort, so a delayed or absent record does not establish that no request occurred.
Product prices and availability are accurate as of the date/time indicated and are subject to change. Any price and availability information displayed on Amazon at the time of purchase will apply.

