
Do these 3 things before closing this tab:
1Fix the driver behind crashes, sound loss and screen glitches2Repair Windows errors before they cause bigger problems3Scan for outdated or missing drivers - takes under a minutePLS’s Universal Debug Engine (UDE) combines embedded-software debugging, trace analysis, testing and automation. At embedded world 2024, PLS demonstrated UDE 2024 on multicore automotive and industrial targets, including workflows aware of operating systems and AUTOSAR. The event took place in Nuremberg on April 9–11, 2024; the demonstrations were at Hall 4, booth 4-310.
What is PLS UDE?
UDE is a professional development environment for debugging and analyzing embedded software on hardware and virtual prototypes. PLS describes support for both high-level and assembler-level debugging, runtime observation, system visualization and system-level analysis. The same environment also covers test automation, in-system flash programming, RTOS support and AUTOSAR software development.
That breadth is what “all-in-one” means here: UDE brings several development and diagnostic activities into one environment. It does not mean that every target has the same debug or trace features; those depend on the microcontroller, its on-chip facilities and the interface hardware used.
What did PLS demonstrate at embedded world 2024?
PLS presented UDE 2024 as a tool for work on multicore systems, with demonstrations spanning automotive and industrial microcontrollers. The target list shows the breadth of the event, but it should not be read as a claim that every listed device was shown running every feature.
Recommended Free Tools
#1 Best Overall

- COMPATIBILITY: Supports multiple Renesas microcontroller families including RH850, RL78, and RX series for debugging and programming
- FUNCTIONALITY: Serves as an in-circuit debugger, emulator, and programmer for efficient embedded system development
- DEVELOPMENT TOOL: Professional-grade debugging capabilities for real-time code analysis and system optimization
- INTERFACE OPTIONS: Provides comprehensive debugging and programming interface for embedded system development
- VERSATILE APPLICATION: Ideal for firmware development, testing, and system programming across Renesas microcontroller platforms
| Target family or device | Context in the 2024 material |
|---|---|
| Infineon AURIX TC4x and TC3xx | Listed by PLS among the demonstration targets. The UDE 2024 release also highlighted AURIX miniMCDS trace and TC4x dual-MCDS/PPU trace. |
| STMicroelectronics Stellar | Listed as a demonstration target; the release highlighted trace support and CAN debugging for ST Stellar. |
| Renesas RH850/U2B | Listed as a demonstration target and among the families receiving trace-support attention in the release. |
| NXP S32 | Listed as a demonstration target. The release separately named added support for NXP KW45. |
| Bosch GTM | Listed by PLS among the demonstration targets. |
| Infineon TRAVEO T2G and XMC7000 | Named in the UDE 2024 release as receiving trace support. |
| STM32H745, STM32H755 and STM32C011 | Named in the release as added device support. |
These are distinct kinds of evidence: a family appearing in the event demonstration list is not necessarily the same as a specific new-support announcement in the release. For a project decision, check the exact device and the required debug or trace function against PLS’s current device support information.
Can UDE debug and trace multicore automotive microcontrollers?
Multicore debugging and tracing were central to the embedded world demonstration, and the release highlighted trace capabilities for specific automotive-oriented families including AURIX TC4x and RH850/U2B. UDE’s purpose includes examining software as it runs, alongside source-level and assembler-level debugging.
Trace capability is target-dependent. Before choosing a workflow, establish what the chip exposes, where captured trace can be stored, the required data rate and whether the intended analysis uses on-chip resources or external capture hardware. A multicore label alone does not establish that every core can be traced simultaneously or at a particular bandwidth.
Does UDE understand AUTOSAR and RTOS software?
Yes. PLS describes RTOS and AUTOSAR-aware debugging as part of UDE, and UDE 2024 specifically highlighted RTOS awareness for SAFERTOS, FreeRTOS, PXROS-HR and MicroC/OS-II, as well as AUTOSAR. This awareness is intended to help developers inspect software in the context of its operating system or AUTOSAR environment rather than treating all runtime activity as unstructured application code.
The Tool Desk
Outbyte Driver Updater FREEFix the driver behind crashes, sound loss and screen glitchesFind Drivers →Outbyte PC Repair FREEClear out junk files and repair common Windows errorsFree Scan →What changed in UDE 2024?
PLS’s release, dated February 7, 2024, emphasized easier trace configuration and broader trace and microcontroller support. UDE SimplyTrace was presented as a way to simplify trace configuration; the release does not establish that it removes target-specific trace constraints or the need for suitable capture resources.
The release also called out AURIX miniMCDS and TC4x dual-MCDS/PPU trace, trace support for TRAVEO T2G, XMC7000, RH850/U2B and ST Stellar, CAN debugging for ST Stellar, and added support for several STM32 devices and NXP KW45. At the time of that February announcement, PLS said UDE 2024 was expected to be available in May 2024. That was a planned availability date, not confirmation of current availability or current product terms.
Rank #3
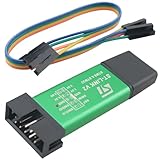
- Product Type: ST-LINK V2 STM8/STM32 emulator programmer stlink downloader burner debugger
- Product Material: the shell is made of aluminum alloy; the USB holder and connectors are made of pure copper and gold-plated; the internal motherboard uses the common FR-4 material circuit board
- Product size: length 56mm/2.20in, width 20mm/0.79in, height 8mm/0.31in
- Product advantages: easy to carry, can effectively prevent static electricity and drop drop; wide compatibility; have a strong debugging function
- Product can be used for Embedded system development, smart home device development, automation industrial control, etc. With ST-LINK V2, developers can quickly debug and burn code to drive devices to run.
What hardware is needed to capture trace?
UDE trace workflows may use trace stored in the target’s on-chip memory or external PLS Universal Access Devices. PLS identifies UAD2next and UAD3+ as devices for debug and external trace storage, and describes a UAD3+ Serial Trace Pod 100G for high-rate trace interfaces. PLS states a transfer rate of up to 100 Gbit/s for that pod; this is a device capability, not a guaranteed rate for every target or trace setup.
- On-chip trace memory: useful when the target provides it, but the amount of available storage and the target’s trace features constrain what can be captured.
- External capture: a UAD device can provide an external path for debug and trace storage. Confirm the specific target, interface and required accessories with PLS.
- High-rate serial trace: the Serial Trace Pod 100G is intended for high-rate interfaces; its stated maximum does not by itself establish end-to-end bandwidth for a particular project.
Trace can support runtime analysis without relying only on software instrumentation, but whether a setup is non-invasive in practice depends on the target’s trace implementation and the capture method. Confirm that distinction for the specific device and measurement before treating trace as a non-intrusive measurement.
Windows Errors? Fix Them Before They Spread
Repair common Windows errors and clear accumulated junk for a smoother, more stable PC - no reinstall needed.Free scan · no reinstallCrashes, No Sound, or Screen Glitches?
Random freezes, missing sound and display glitches usually trace back to one bad driver. Find and replace yours safely.Free scan · under a minuteCan UDE automate tests and measure code coverage?
PLS includes test automation in UDE’s product scope, so automated test workflows are part of the environment. The available product and release facts do not specify particular test frameworks, scripting interfaces, reporting formats or coverage metrics, however. They also do not establish that non-intrusive code coverage is available for every supported target. Ask PLS to confirm the required coverage method, target support and any instrumentation or trace prerequisites for your use case.
How should you evaluate or buy UDE?
Start with the exact microcontroller and the development task, not just the product name. PLS publishes UDE datasheets, manuals and webinars, and offers direct sales and support contacts. Because the event and release information dates from 2024, confirm current device support, software availability, license terms and hardware requirements directly with PLS or a verified reseller.
Quick Recap
- Match the target: identify the exact device and core configuration, then confirm support for the compiler, debug features and trace sources you need.
- Define the measurement: specify whether you need source debugging, RTOS/AUTOSAR awareness, runtime trace, test automation or a particular coverage metric.
- Plan capture hardware: check whether on-chip trace memory is sufficient or an external UAD interface is required, including the trace interface and expected data rate.
- Confirm commercial and support terms: request current licensing, configuration and regional availability details from PLS or a verified reseller.
Product prices and availability are accurate as of the date/time indicated and are subject to change. Any price and availability information displayed on Amazon at the time of purchase will apply.

