
iTechGuides is reader-supported. When you buy through links on our site, we may earn an affiliate commission. As an Amazon Associate I earn from qualifying purchases. Learn more
To place theta ticks on a Matplotlib polar plot, call ax.set_thetagrids(angles, labels=...) with angles in degrees. It sets the angular gridline and tick-label positions in one call. The pyplot equivalent, plt.thetagrids(...), acts on the current polar axes. For tick placement that should survive zooming, panning, or other view changes, configure the theta axis locator and formatter instead. Those two approaches behave differently, and most problems with theta ticks come from mixing them up.
Set fixed theta positions and labels
A polar axes is created with subplot_kw={"projection": "polar"}. Its angular axis is the theta axis, and set_thetagrids is the method that controls which angles receive a gridline and a label.


import matplotlib.pyplot as plt

fig, ax = plt.subplots(subplot_kw={"projection": "polar"})
ax.set_thetagrids([0, 45, 90, 135, 180], labels=["N", "NE", "E", "SE", "S"])
plt.show()
Three details matter here:
- Angles are in degrees. Even though the polar axis stores angles internally in radians,
set_thetagridsaccepts degrees, so90means a quarter turn. - Labels are optional. The
labelslist pairs with the angle list by position. If you omit it, Matplotlib uses its default theta formatter. - The return value is useful. The method returns the theta gridline objects and the text label objects, which you can keep and inspect or restyle.
The pyplot form
plt.thetagrids accepts the same kind of positions and names and applies them to the current polar plot. It is convenient in short scripts where you already rely on implicit figure and axes state:
Crashes, No Sound, or Screen Glitches?
Random freezes, missing sound and display glitches usually trace back to one bad driver. Find and replace yours safely.Free scan · under a minuteWindows Errors? Fix Them Before They Spread
Repair common Windows errors and clear accumulated junk for a smoother, more stable PC - no reinstall needed.Free scan · no reinstallimport matplotlib.pyplot as plt
plt.subplot(projection="polar")
plt.thetagrids(range(45, 360, 90), ("NE", "NW", "SW", "SE"))In object-oriented code, prefer the axes method. It makes clear which axes is changed, which matters once a figure contains more than one subplot.
How the default labels are generated
When you do not supply labels, the default formatter does the work. The Matplotlib API reference for matplotlib.projections.polar describes ThetaFormatter this way:
“Used to format the theta tick labels. Converts the native unit of radians into degrees and adds a degree symbol.”
Rank #2

- Ideal for Both Hobbyists and Experts - Whether you’re a seasoned designer or a regular doodler, this circular grid sketchpad is for you. Create geometric patterns and practical designs with ease using polar drawing grid paper.
- Elevates Your Artwork - Printed with thin, non-reproducible teal-colored lines, our circular pattern drawing pad makes your masterpiece stand out, so you can capture it without the lines.
- Handy Notebook for Quick Sketches - Measuring 8.5 x 8.5 inches, our polar graph sketchpad fits perfectly in any bag. Bring this drawing pad along with your other needed tools for a quick mandala drawing session.
- Spiral Bound Binding Lays Flat - And the perforated sheets allow for easy sheet removal. Thicker chip board front and back cover make for a sturdier and more durable sketch pad.
- Engaging Drawing Pad - Creating radial patterns is a relaxing, engaging activity. With 60 double-sided pages, you’ll never run out of space for your mesmerizing sketchbook drawings.
So the native value is radians, and the label you see is degrees with a ° sign. The default ThetaLocator delegates to its base locator, except when the view spans the full circle. In that case it uses the familiar 45-degree positions.
Quick wins for a faster PC:
Repair Windows errors before they cause bigger problemsFix Now →Scan for outdated or missing drivers - takes under a minuteDriver Scan →Clear out junk files and repair common Windows errorsFree Scan →Using the fmt argument
set_thetagrids accepts a fmt string that is handled by FormatStrFormatter. The value passed to that format string is the angle in radians, not degrees. A format string therefore only helps if you want to change how a number is written, not what it means. If you pass fmt="%d" expecting degrees, you will get radian values truncated to integers, which is almost never what you want. For degree-based text with custom logic, use a function-based formatter, as described below.
Control positions and labels when the view changes
Fixed positions set by set_thetagrids are convenient for static figures, but they are not a durable configuration. The API reference states that set_thetagrids changes the properties of the current tick instances only. Interactive panning and zooming, and other later operations, can create, delete, or modify those tick instances, so the styling you applied may disappear or revert.
If tick placement or labels must hold as the view changes, set the theta axis’s major locator and major formatter. The steps are:
- Import the locator and formatter classes:
from matplotlib.ticker import FixedLocator, FuncFormatter. - Convert your desired degree positions to radians with
np.radians, because locators on a polar theta axis work in the native unit. - Set the locator with
ax.xaxis.set_major_locator(FixedLocator(...)). The theta axis of a polar axes is the x axis. - Set the formatter with
ax.xaxis.set_major_formatter(FuncFormatter(...)). The function receives the tick value in radians and a position argument, and returns the string to display.
import numpy as np
import matplotlib.pyplot as plt
from matplotlib.ticker import FixedLocator, FuncFormatter

fig, ax = plt.subplots(subplot_kw={"projection": "polar"})

ticks_deg = [0, 45, 90, 135, 180]
ax.xaxis.set_major_locator(FixedLocator(np.radians(ticks_deg)))
ax.xaxis.set_major_formatter(
    FuncFormatter(lambda rad, pos: f"{np.degrees(rad):.0f}°")
)
plt.show()
This pattern does not rely on the state of individual tick instances, so it is the right choice when labels need to follow the axis rather than a single snapshot of it. The example above is a standard approach from the locator and formatter interfaces; it has not been tested against a specific Matplotlib release in this article.
Choosing an approach
| Approach | Best for | Angle units you pass | Survives zoom or pan |
|---|---|---|---|
ax.set_thetagrids(angles, labels=...) |
Static figures with named positions such as compass points | Degrees | Not guaranteed; treat as a snapshot of current ticks |
plt.thetagrids(...) |
Short pyplot scripts working on the current polar plot | Degrees | Not guaranteed; same behaviour as the axes method |
Major locator and formatter on ax.xaxis |
Labels that must stay correct as the view changes | Locator values in radians; formatter receives radians | Yes, because the axis regenerates ticks from its locator and formatter |
Orientation and angular range are separate settings
Tick positions do not decide where zero sits or which direction angles increase. Those are configured on the axes:
Best Value
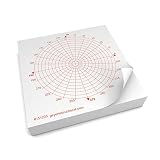
- These Polar graphing Post-It Notes are marked in degrees
- Ideal for exit tickets, warm-up activities, and interactive math notebooks
- Great for leaving notes on students work or anywhere these sticky notes will fit.
- Four Pack of 100 Sheet Pads
- Features adhesive on the top of each sheet!
ax.set_theta_zero_location(...)chooses where zero is placed. The offset you pass is always applied counterclockwise, whatever the direction setting is.ax.set_theta_direction(...)selects clockwise or counterclockwise increase.ax.set_thetalim(...)sets the visible angular range. Its positional arguments are in radians, while the keyword argumentsthetamin=andthetamax=are in degrees.
The official polar demo restricts the visible angular range with set_thetamin(0) and set_thetamax(225). Changing the range alters which tick positions are visible, so set the range first, then confirm that your chosen positions still fall inside it.
Troubleshooting: why theta tick styling did not stick
Most surprises trace back to one of three causes:
- Styling applied to existing ticks. Font size, color, or label text set through
set_thetagridsbelongs to the ticks that exist at that moment. After a zoom or redraw, Matplotlib may create new tick instances. Move the configuration to the locator and formatter. - Radian values where degrees were expected. A formatter that prints its input directly will show values such as
3.14rather than180. Convert withnp.degreesinside the formatter. - Positions outside the visible range. If you restrict the view with
set_thetalimor the degree keywords, ticks outside that span will not appear, even though they were set.
Version and source notes
The behaviour described here comes from the Matplotlib stable documentation: the PolarAxes API reference (labelled 3.11.1), the pyplot thetagrids reference (labelled 3.11.0), and the ticker and polar demo pages (labelled 3.11.2). Minor patch versions may differ slightly, so check the reference for your installed release if a detail does not match. The examples above are written against those documented interfaces and have not been executed as part of this article.
Quick Recap
Product prices and availability are accurate as of the date/time indicated and are subject to change. Any price and availability information displayed on Amazon at the time of purchase will apply.
Free tools Windows power users keep installed
One-click scans. No signup required.

