
Crashes, No Sound, or Screen Glitches?
Random freezes, missing sound and display glitches usually trace back to one bad driver. Find and replace yours safely.Free scan · under a minutePC Slower Than It Used to Be?
A free scan shows the junk files, broken settings and background clutter dragging Windows down - then fixes them in one click.Free scan · Windows 10 & 11iTechGuides is reader-supported. When you buy through links on our site, we may earn an affiliate commission. As an Amazon Associate I earn from qualifying purchases. Learn more
You can build this, and the order matters. Pull the previous day’s historical data from DeyeCloud once, check and normalize it, calculate the report figures in ordinary code, and only then send a small structured summary to Amazon Bedrock to write the prose. Bedrock is the writing layer. It should not fetch your data or do your arithmetic.
This guide assumes you already have an eligible DeyeCloud plant and account, and AWS access with Bedrock available. The official material confirms the developer-application prerequisite, the reporting cadence and the basic usage limits, but it does not publish one canonical endpoint sequence, a report schema or a deployment architecture. The design below is an implementation pattern you can test against your own plant. It is not an official Deye recipe.
What you need before you start
- An eligible DeyeCloud account with at least one plant you can see in the portal at developer.deyecloud.com.
- A DeyeCloud developer application and its credentials. The official sample repository tells you to begin with QuickStart material and access-token acquisition.
- An AWS account with Amazon Bedrock enabled in the region you plan to use, plus permission to invoke the foundation model you select. Model availability varies by region, so check the Bedrock console for your region before you design around a specific model. The Amazon Bedrock documentation is the reference for this.
- A scheduler that runs once a day after the plant’s local day has closed, such as a cron entry, an EventBridge schedule or a similar job runner.
The pipeline in five stages
- Authenticate and fetch the previous day’s historical data for each plant.
- Normalize the response: plant timezone, date boundaries, units and missing readings.
- Compute every report figure in code and store the result as a structured facts object.
- Send only that facts object to Bedrock and ask for a short narrative.
- Validate the narrative against the facts, then store and deliver the report.
Each stage can fail on its own, so log the output of each one separately. A report that says “generation was 0.0 kWh” because the fetch failed is worse than no report at all.
Step 1: Register and get credentials
Start at the DeyeCloud Developer Portal, register, and create a developer application. The DeyeCloudDevelopers API v1 sample repository is the most concrete starting point in the official material. Its examples are in Python and show how to obtain an access token.
#1 Best Overall

- Comprehensive Measurement Capabilities: This multi-functional watt meter power analyzer accurately measures voltage, current (amp meter), power, discharge capacity, and time. It serves as both a solar panel tester and solar power meter, compatible with solar, wind, EV, and battery systems (voltage range: 4.8-60V)
- Superior Measurement Precision: With an optional auxiliary battery, this battery monitor operates at 12V-100V. Key specs: 0-200A current (0.01A accuracy); 0-100V voltage (0.01V resolution); 0-6554W power (0.01W resolution); 0-65Ah capacity (0.001Ah resolution). Note: Designed for systems below 100V and 200A-do not exceed these rated limits. Compatible with 12 AWG wiring
- Versatile Applications: This high-precision power analyzer caters to diverse operational needs. It effectively evaluates RC battery charging efficiency, power consumption of battery-powered devices, and operating voltage-ensuring batteries, motors, wiring, and connectors function reliably
- Enhanced Backlight Display: Ultra-bright illumination ensures clear visibility for solar power meter use in low-light environments or outdoor solar panel testing, day and night
- Sizing Compatibility Reminder: Please verify connector specifications via your measurement chart before purchase to ensure seamless integration with your solar or wind power setup
The portal pages available at the time of writing did not expose endpoint-level detail. Take endpoint paths, parameter names and response fields from the current API reference you can see after signing in, and treat the sample repository as working code to adapt rather than as complete documentation.
Store the application credentials outside your source code, for example in AWS Secrets Manager or in environment variables set by your job runner. Cache the access token for its valid lifetime and request a new one when a call returns an authentication error. Then make one request for a known plant and compare the result with the same day shown in the portal. Do not build the rest of the pipeline until that comparison matches.
Step 2: Decide how often to fetch
For a daily report, fetch once per day. DeyeCloud’s API Usage Best Practices page, updated September 20, 2026, gives different cadences for different products:
Do these 3 things before closing this tab:
1Clear out junk files and repair common Windows errors2Fix the driver behind crashes, sound loss and screen glitches3Repair Windows errors before they cause bigger problems| Use case | Recommended fetch frequency | Source and date |
|---|---|---|
| Real-time monitoring dashboard | Every 1 to 2 minutes | DeyeCloud API Usage Best Practices, updated September 20, 2026 |
| Historical daily or weekly reports | Once per day | DeyeCloud API Usage Best Practices, updated September 20, 2026 |
The same page explains the reasoning in one line: “Historical daily/weekly reports | Once per day | Historical data doesn’t change retroactively.” Because a closed day does not change, you should not re-query it on every run. Store the raw response for each plant and date, and re-derive the report from that stored copy if you change your calculations later.
Rank #2
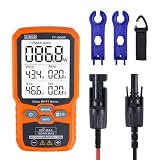
- ⚡ Professional-Grade PV Testing Measures maximum power (Pmax) up to 1000W, open-circuit voltage (Voc: 12-80V), and short-circuit current (Isc: 35A) with ±0.8% accuracy, ideal for validating solar panel performance in R&D, manufacturing, and field maintenance.
- ⚡ MPPT Efficiency Optimization Tracks Vmp (80V) & Amp (35A) in real-time to identify panel degradation or shading issues, helping installers maximize energy harvest and ROI for residential/commercial systems.
- ⚡ Industrial Safety & Durability Rated CAT III 1000V/CAT IV 600V with double-insulated probes, meeting IEC/EN 61010 standards for safe use on high-voltage PV arrays and combiner boxes.
- ⚡ Smart Data Management Features data hold + backlit LCD for reading values in dark environments (e.g., rooftops)
- ✅ Engineered for Solar Professionals Auto-ranging simplifies operation for technicians, while IP54 dust/water resistance and low-power auto-off ensure reliability in outdoor installations.
Quota figures and what they mean for a daily job
DeyeCloud’s September 20, 2026 guidance lists two usage figures. Both are described as preliminary, and the page states that final rules will be announced separately.
| Figure | Value published | Status as stated by DeyeCloud |
|---|---|---|
| Base quota | 100,000 calls per month | Preliminary; final rules to be announced separately |
| Request rate | 60 requests per minute | Preliminary; final rules to be announced separately |
A daily job that makes a small number of calls per plant sits far below these figures, as long as each call covers one day or a short range. Do not treat the numbers as contractual limits. Check the portal before you size a fleet of plants or plan a large backfill.
Handle rate limits and server errors
DeyeCloud’s guidance suggests backoff for rate-limit and server errors. In practice, retry with an increasing delay and a small random offset, cap the number of attempts, and mark the day as failed if all attempts are used. Do not retry an authentication failure in a loop; refresh the token once and then stop.
Step 3: Normalize before you calculate
Most bad solar reports come from this step, not from the language model. Settle three things before you write any calculation code.
Rank #3

- SAFETY YOU CAN TRUST WITH UL CERTIFICATION: With Emporia Energy, your home energy monitoring is safe, reliable, and certified. The Emporia Vue is UL Listed, meaning it has met rigorous safety standards for electrical products in the U.S. and Canada. This certification ensures that every component has been thoroughly tested to prevent hazards, such as overheating, short-circuiting, or fire, offering you peace of mind as you manage your home’s energy consumption.
- INSTALLS IN CIRCUIT PANEL of most homes with clamp-on sensors. Supports Single phase, Single-split phase, and 2-wire systems. 3-wire systems; 3-phase, 4-wire Wye systems with earthed (TN or TT) neutral (no-Delta) are supported with an additional 200A sensor (sold separately).
- 24/7 ENERGY MANAGEMENT AND MONITORING: Automate, manage and control your home's real power anywhere, anytime to prevent costly repairs, conserve energy, and save costs. Monitor solar / net metering. PROTECTED BY A 1-YEAR WARRANTY.
- LOWER YOUR ELECTRIC BILL: Configure settings in the Emporia Energy App to automate energy management for time of use, peak demand, excess solar, and rewards programs. You can even see live reporting and invaluable savings opportunities instantly. Gauge real-time spending and get actionable notifications and automated energy management to help you reduce costs.
- REAL-TIME ENERGY DATA: REQUIRES 2.4 GHz WIFI WITH AN INTERNET CONNECTION to monitor energy use with iPhone / Android / Web app. Vue sensors collect energy data and are accurate from ±2%. The Vue is UL and CE Listed for your safety. 1 second data is only available in the app (when actively open) and retained 3 hours. Minute and hour data are retained in the cloud. 1 minute data is retained 7 days, 1 hour data is retained indefinitely. Export cloud data whenever you want in the app.
Define the day in the plant’s timezone
A report day should run from local midnight to local midnight at the plant, not in the timezone of your server or of AWS. Store the timezone name with each plant, not just an offset, so daylight-saving transitions are handled correctly. Test one transition day explicitly, because it will have 23 or 25 hours and a naive 24-hour assumption will misplace readings.
Convert units once, at ingestion
Energy and power may come back in different units from different endpoints or fields. Convert everything to one unit at the point of ingestion, keep the unit in the stored object, and check one day’s totals against the figure shown in the portal. Write the unit into the report header so a reader can see it.
Separate measured, estimated and absent values
A missing reading is not a zero. Give each value one of three statuses and make the status visible in the report.
| Status | Meaning | Example wording in the report |
|---|---|---|
| Measured | Returned directly by the API for the full interval | Generation: 18.4 kWh (measured) |
| Estimated | Filled by a documented rule in your own pipeline | Generation for 10:00 to 11:00 estimated from the surrounding hours |
| Absent | No value returned for the interval | No data received for 10:00 to 11:00 |
If the API returns nothing for the whole day, the report should say there is no data for that day. It should not show a total of zero.
Rank #4

- Test range: Voltage: DC 8~100V; Current: 0~100A; Power: 0~10kW; Energy: 0~9999kWh
- Store energy data when power off (can be reset to 0). The blue backlight can be turned on/off manually
- With overload alarm function (If active power is larger than threshold, backlight and power value will flash)
- 4 in 1 meter; Large-screen LCD (displays voltage, current, active power, energy at the same time)
- Note: Only display and shunt are included. It doesn't include any wire or accessories
Step 4: Compute the report facts in code
Calculate every number the report will state in ordinary code, with tests. Typical facts for a daily solar report include:
- Total generation for the local day, with its unit and status.
- Peak power and the local time it occurred, if the interval data supports it.
- Data coverage: the share of the day’s intervals that returned a measured value.
- Change from the previous day and from the trailing seven-day average, calculated only when both values exist.
- Any flags such as a gap longer than a set threshold or a day with no data.
Define the comparison rules before you code them. A previous day with zero or missing data should produce “comparison not available”, not a percentage. The output for a normal day looks like this, with illustrative values rather than measurements:
{
  "plant_id": "plant-001",
  "local_date": "2026-10-08",
  "timezone": "Europe/Berlin",
  "generation_kwh": {"value": 18.4, "status": "measured"},
  "peak_power_kw": {"value": 6.2, "at_local_time": "12:40", "status": "measured"},
  "coverage_pct": 96,
  "vs_previous_day_kwh": {"value": 1.1, "status": "measured"},
  "vs_7day_avg_kwh": "not available",
  "flags": ["gap 10:00-10:20 absent"]
}
Keep this object as the only input the language model sees for the figures. Its numbers are the ones your report may state.
Recommended Free Tools
Step 5: Ask Bedrock for the prose
Send the facts object to a Bedrock model that supports the runtime operation you use, and ask for a short narrative. The model’s job is to turn structured figures into readable sentences, nothing more.
Best Value

- SAFETY YOU CAN TRUST WITH UL CERTIFICATION: With Emporia Energy, your home energy monitoring is safe, reliable, and certified. The Emporia Vue is UL Listed, meaning it has met rigorous safety standards for electrical products in the U.S. and Canada. This certification ensures that every component has been thoroughly tested to prevent hazards, such as overheating, short-circuiting, or fire, offering you peace of mind as you manage your home’s energy consumption.
- INSTALLS IN CIRCUIT PANEL of most homes with clamp-on sensors. Supports Single phase, Single-split phase, and 2-wire systems. 3-wire systems; 3-phase, 4-wire Wye systems with earthed (TN or TT) neutral (no-Delta) are supported with an additional 200A sensor (sold separately).
- 24/7 ENERGY MANAGEMENT AND MONITORING: Automate, manage and control your home's real power anywhere, anytime to prevent costly repairs, conserve energy, and save costs. Monitor solar / net metering. PROTECTED BY A 1-YEAR WARRANTY.
- LOWER YOUR ELECTRIC BILL: Configure settings in the Emporia Energy App to automate energy management for time of use, peak demand, excess solar, and rewards programs. You can even see live reporting and invaluable savings opportunities instantly. Gauge real-time spending and get actionable notifications and automated energy management to help you reduce costs.
- REAL-TIME ENERGY DATA: REQUIRES 2.4 GHz WIFI WITH AN INTERNET CONNECTION to monitor energy use with iPhone / Android / Web app. Vue sensors collect energy data and are accurate from ±2%. The Vue is UL and CE Listed for your safety. 1 second data is only available in the app (when actively open) and retained 3 hours. Minute and hour data are retained in the cloud. 1 minute data is retained 7 days, 1 hour data is retained indefinitely. Export cloud data whenever you want in the app.
Write a bounded instruction
The instruction should tell the model to use only the figures supplied, to state no new numbers, to describe any field marked absent or not available as missing, and to keep the summary to a fixed number of sentences. Give it the report date and plant name, and nothing about credentials, account identifiers or other plant data.
Validate the output before publishing
Extract every number and unit from the generated text and check that each one appears in the facts object, after the same formatting rules you use for display. If a figure is missing from the facts, or a sentence describes an absent value as a measured one, reject the output. Retry once with the same input. If the second attempt also fails, publish a plain template version built directly from the facts. The template is less readable, but it cannot invent a figure.
Independent reader supportYour contribution helps us test, update, and keep practical guides available for everyone.Logging and what goes into the prompt
Bedrock invocation logging is off by default. AWS states: “Model invocation logging is disabled by default.” If you enable it, request and response data for supported bedrock-runtime operations may be captured in Amazon S3, CloudWatch Logs or both. Read the model invocation logging guide before you turn it on, and check the logging settings in your Bedrock console.
The Tool Desk
Outbyte PC Repair FREERepair Windows errors before they cause bigger problemsFix Now →Outbyte Driver Updater FREEFix the driver behind crashes, sound loss and screen glitchesFind Drivers →| Logging destination | What it means for this report | What to check |
|---|---|---|
| Amazon S3 | Prompts and responses are written as objects to a bucket you specify | Bucket access policy, encryption and a lifecycle rule that sets retention |
| CloudWatch Logs | Prompts and responses are sent to a log group you specify | Who can read the log group and the retention period you set |
Because logs can contain whatever you sent, decide what goes into the prompt before you decide where logs go.
| Field | Send to the model? | Reason |
|---|---|---|
| Generation totals, peak power, coverage and flags | Yes | The prose needs these figures |
| Plant display name | Optional | Useful for the reader, but it may reveal a location |
| Logger or device serial numbers | No | Identifies hardware and is not needed for prose |
| Owner name, street address or contact details | No | Personal data the summary does not require |
| Raw interval series | No | The model should not calculate from it; your code already has |
| Access tokens or application credentials | Never | Credentials must not appear in prompts, logs or reports |
Store and deliver the report
Store four objects for each plant and date: the raw API response, the normalized facts, the generated prose, and the validation result. Key them by plant and local date so a rerun overwrites nothing you did not intend to change. Put a short header on the delivered report with the plant timezone, the reporting interval, the unit set and the data status, so a reader can judge the figures without opening your code.
Checks to run against your own plant
- Authentication: a valid token returns data; an expired or invalid token triggers one refresh and then a clear failure.
- Pagination: if a response is split across pages, the job collects every page and does not stop at the first.
- Empty and partial days: a day with no data yields a “no data” report, and a day with a gap yields an absent flag.
- Units: one day’s total matches the figure shown in the portal after conversion.
- Daylight-saving transition: the local day has the correct number of hours and no reading is double-counted or dropped.
- Error handling: rate-limit and server errors trigger backoff, and a failed day is recorded as failed.
- Validation: a deliberately wrong number in generated text is rejected.
- Logging: confirm whether invocation logging is on, where it writes, and that the prompt contains no excluded field.
This list describes what to test. It does not report results from any plant, and you should run each check yourself before relying on the report.
What the official sources do and do not establish
- Established: a DeyeCloud developer application is the starting prerequisite, historical daily reports are recommended once per day, and DeyeCloud describes its usage figures as preliminary.
- Established: Bedrock is a managed foundation-model service, and invocation logging is off by default.
- Not established: a canonical endpoint sequence, the report data schema, the meaning of each response field, or the final quota rules.
- Not established: which Bedrock models are available in your region, or what they cost. Those details change, so check the AWS documentation directly.
͏
Where a figure in this guide comes from DeyeCloud or AWS, the source and its date are given next to it, so you can check whether it has changed since.
Free tools Windows power users keep installed
One-click scans. No signup required.
Quick Recap
Product prices and availability are accurate as of the date/time indicated and are subject to change. Any price and availability information displayed on Amazon at the time of purchase will apply.

