
What’s actually slowing this PC down?
Pick the symptom - the matching free tool is one click away.
iTechGuides is reader-supported. When you buy through links on our site, we may earn an affiliate commission. As an Amazon Associate I earn from qualifying purchases. Learn more
Data storytelling turns analysis into a message a particular audience can understand and use. A practical way to do it is to define the decision or takeaway first, learn what your audience needs, gather and examine relevant data, shape the evidence into a narrative, choose visuals that fit the question, and deliver a clear implication. These seven steps are a useful workflow, not a universal standard; the order can vary with the project.
What is data storytelling?
Data storytelling connects evidence to a message for a specific audience. It is more than putting a chart in a report: the analysis establishes what the data supports, the narrative explains why the finding matters, and the presentation helps people decide what to do next.
For a running example, imagine a retailer reviewing sales to plan inventory and promotions. The figures might show seasonal patterns across product categories and locations. The purpose is not just to display those figures, but to make a defensible recommendation to the people who can act on them.
The Tool Desk
Outbyte Driver Updater FREEFix the driver behind crashes, sound loss and screen glitchesFind Drivers →Outbyte PC Repair FREERepair Windows errors before they cause bigger problemsFix Now →1. Define the story you want to tell
Start with the question your analysis should answer or the decision it should support. Write a tentative takeaway before choosing charts or collecting more data. For the retailer, that might be: “Which seasonal demand peaks should inform inventory planning?” This is a question to investigate, not a conclusion to assume.
#1 Best Overall

- Stable Tripod Stands: maxtek easel white board comes with a steel pipe tripod with rubber feet, making it stand firmly whether you write or erase. The collapsible & lightweight tripod can be moved to other places for different uses, providing more convenience
- Adjustable Height: There are scale markings on the tripod legs of the flipchart easel board, which help adjust the height and balance the white board easily and accurately from 42-63 inches. Whether sitting or standing, whether kids or adults, you can find the most comfortable height you like
- Ease to Write & Wipe: the easel white board surface is finished with a high-end three-layered baking, making it highly solid & anti-scrap, easy to dry wipe with all dry-erase markers. The surface can also create high-contrast markings to make communication or presentation more effectively
- Great in Value: maxtek 24x36 inches stand white board comes with all that you need to get started: 2 flipchart hooks, 1 magnetic eraser, 3 pens, 6 magnets, and a detachable tray for writing supplies
- Upgraded Packaging: To prevent shipping and handling damages, the dry erase board is packaged in a reinforced box with thick cardboard, corner protectors, and additional foam padding to secure the board
A focused question helps separate relevant evidence from interesting but distracting details. Keep the intended message provisional until the data has been checked; if the evidence does not support it, revise the story rather than forcing the evidence to fit.
2. Know your audience
Identify who will use the result, what they already understand, and what they need to decide. Executives may need a concise view of demand and its operational implications, while marketing staff may need category or promotion detail. The same analysis can serve both groups, but the level of explanation and emphasis should differ.
- What decision can this audience make?
- Which terms, measures, and assumptions will need explanation?
- What level of detail helps them act without obscuring the main point?
3. Collect appropriate data
Choose data that can answer the question, and state its scope clearly. In the retail example, useful fields could include sales by season, product category, location, and year. The KDnuggets example considers four years of data; that is an illustrative scenario, not a general requirement. The appropriate period depends on the question and the data available.
Rank #2
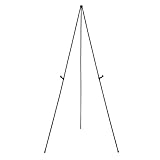
- Durable metal and plastic tabletop display easel supports items up to 5 pounds for lightweight posters or signage
- Easily sets up in seconds without extra tools needed, ideal for use at the office or on the road at workshops, conferences, or business meetings
- Lightweight for easy transport and storage
- Plastic clip helps improve visibility by adjusting the display height, simply unclip and slide the display holders to different positions
- Non-slip rubber feet that won't scratch or marr surfaces
Check whether the data covers the relevant products, locations, and time periods, and whether its definitions are consistent enough to compare. If an important category or period is missing, disclose that boundary instead of implying the result covers more than it does.
4. Understand the data before writing the story
Explore patterns, comparisons, and anomalies before drafting an explanation. The retailer might find holiday sales peaks, summer beachwear demand, or an unexpected sales drop. Those observations describe what happened in the data; they do not, by themselves, explain why it happened.
Separate description from causation. A drop coinciding with a promotion change, for example, does not establish that the change caused the drop. A causal claim needs evidence or a study design that can support it. Where the cause is uncertain, present the pattern and identify what remains unknown.
Rank #3

- Strong and Durable: The aluminum frame is lightweight yet durable. Its smooth surface allows for effortless writing and ghost-resistant erasing. The board also features strong magnetic properties for versatile use
- Stable Tripod Stands: Features a stable triangular tripod stand with non-slip rubber feet, ensuring always slip-free use. Its lightweight design ensures easy portability and convenient storage for everyday use
- Height Adjustable: This 40" x 28" whiteboard features an adjustable easel stand with a height range from 42 to 65.4 inches. This makes it suitable for both adults and students to use comfortably, whether sitting or standing
- Easy to Install: Includes all necessary tools for quick setup within just a few minutes. Comes complete with 1 eraser, 3 markers, 6 magnets, 2 hooks, and 1 tray. Contact us if any parts are missing or need replacement
- Versatile & Reliable: Ideal for use in office, school, or home settings. We offer full functionality to meet your daily needs and are committed to providing after-sales support for any quality issues you may encounter
5. Build a narrative from the evidence
One practical structure is context, key actors, challenge, and possible response. Introduce the business question, identify the categories or locations that matter, explain the finding, then connect it to a response the audience can consider. For the retailer, a verified seasonal peak could prompt a review of inventory timing.
Recommended Free Tools
Make the boundary between finding and recommendation visible. “Sales rose during the holiday period” is an observation; “increase stock before that period” is a recommendation that also depends on cost, supply, and the consequences of overstocking. A useful story does not conceal those assumptions.
6. Choose a visualization that fits the question
Pick a visual form based on what readers need to compare, not on decoration. The examples below are practical starting points, not a universal chart-selection rule.
Rank #4

- Strong and Durable: The aluminum frame is lightweight yet durable. Its smooth surface allows for effortless writing and ghost-resistant erasing. The board also features strong magnetic properties for versatile use
- Stable Tripod Stands: Features a stable triangular tripod stand with non-slip rubber feet, ensuring always slip-free use. Its lightweight design ensures easy portability and convenient storage for everyday use
- Height Adjustable: This 40" x 28" whiteboard features an adjustable easel stand with a height range from 42 to 65.4 inches. This makes it suitable for both adults and students to use comfortably, whether sitting or standing
- Easy to Install: Includes all necessary tools for quick setup within just a few minutes. Comes complete with 1 eraser, 3 markers, 6 magnets, 2 hooks, and 1 tray. Contact us if any parts are missing or need replacement
- Versatile & Reliable: Ideal for use in office, school, or home settings. We offer full functionality to meet your daily needs and are committed to providing after-sales support for any quality issues you may encounter
| Question | Possible visual | Retail example |
|---|---|---|
| How does a measure change over time? | Line chart | Compare monthly sales across seasons or years. |
| How do categories compare? | Bar chart | Compare sales across product categories. |
| Where do values differ geographically? | Heat map | Show how sales patterns vary by location. |
After choosing a chart, check that its labels and units are clear, the comparisons are easy to see, and the visual supports the stated takeaway. StoryIQ’s “5Ds” is a separate, compact approach to visual communication: define the takeaway, draft the storyline, display the data, declutter the display, and direct audience attention. Its available description is an excerpt, so it is best treated as a high-level design aid rather than a detailed alternative procedure.
Independent reader supportYour contribution helps us test, update, and keep practical guides available for everyone.7. Communicate the story and its implication
Deliver the result in a format suited to the audience, such as a report or interactive dashboard. Use plain language, make the main finding easy to locate, and state what decision the evidence can inform. Include enough context for readers to interpret the data and enough qualification to avoid making the result sound more certain or comprehensive than it is.
Outdated Drivers Are Slowing You Down
One free scan finds every outdated or missing driver and matches the right update for your exact hardware.Free scan · exact hardware matchPC Slower Than It Used to Be?
A free scan shows the junk files, broken settings and background clutter dragging Windows down - then fixes them in one click.Free scan · Windows 10 & 11Close the communication with the supported implication and the remaining uncertainty. In the retailer example, the analysis might support reviewing stock plans for a seasonal peak, while leaving the reason for an unexpected drop unresolved. That distinction helps decision-makers act without mistaking an observation for a proven cause.
Best Value

- [What You Get ] Board dimensions: 36" x 24" ( frame included); Writing surface size: 34" x 22"; The magnetic easel white board comes with 1 pen-tray, 2 hooks, 1 flipchart pad, 1 dry eraser, 2 markers and 4 magnets(random color for accessories), movable hook is used for hanging paper.
- [Smooth Writing and Easy Wipe] Smooth & durable magnetic writing surface, easily dry wipe with all dry-erase markers. Give you a very smooth writing experience.
- [Height Adjustable ] Magnetic whiteboard; Height adjustable:64 inches (max) 46 inches (min); Suitable for adults and children, you can adjust suitable height to get comfortable writing posture.
- [Portable Design] The whiteboard with Easy installation, small size easy to carry, strong function. Lightweight aluminum frame and portable foldable design, very fit for outdoor education.
- [Warmly Remind] If you have any questions about VIZ-PRO whiteboard, please contact us by e-mail freely, Surely help you solve the problems.
How this workflow differs from other approaches
Not every data-storytelling framework has the same goal. KDnuggets’ seven steps focus on communicating an analytical insight to an audience. Actito’s marketing-oriented workflow begins with objectives and data sources, then addresses use, qualification, structure, activation, and ongoing optimization. The approaches differ in their starting point, scope, and endpoint:
| Framework | Starting point | Scope | Endpoint |
|---|---|---|---|
| KDnuggets’ seven steps | Story and audience | Analysis and communication of an insight | Presentation to an audience |
| Actito’s workflow | Business objectives and source inventory | Marketing data use and activation | Ongoing activation and optimization |
| StoryIQ’s 5Ds | Define the takeaway | Storyline and visual communication | Direct audience attention |
These frameworks should not be blended into a single attributed method: one is a practical communication sequence, one is oriented toward customer-data marketing, and one is a concise visual-design approach.
Quick Recap
Sources and further reading
- KDnuggets: “7 Steps to Master the Art of Data Storytelling,” by Iván Palomares Carrascosa, July 30, 2024 — the seven-step sequence and retail illustration.
- Actito: “Data Storytelling: A Recipe to Make Data Speak,” February 17, 2020 — a marketing-focused alternative workflow.
- StoryIQ: “What is Data Storytelling? Definition and Examples” — the available excerpt describes the 5Ds and points to the book Data, Story, Action!.
Product prices and availability are accurate as of the date/time indicated and are subject to change. Any price and availability information displayed on Amazon at the time of purchase will apply.

