
iTechGuides is reader-supported. When you buy through links on our site, we may earn an affiliate commission. As an Amazon Associate I earn from qualifying purchases. Learn more
Memory-chip prices move in cycles because demand, product mix, inventories and usable supply rarely change at the same speed. A surge in AI servers can tighten high-bandwidth memory (HBM), server DRAM and enterprise SSDs while leaving other products on a different path. Customers may then rush to secure supply, or pause orders while consuming inventory, amplifying the move. New capacity eventually arrives, but fab construction, equipment installation, process qualification, packaging and yield improvement take long enough that investment made today cannot immediately relieve a shortage.
This article uses “stock cycle” in the semiconductor sense of inventory and production stocks. A memory company’s share price can react to the same expectations, but equity valuation is a separate market with additional drivers.

Memory is several markets, not one commodity
“Memory” covers products with different architectures, customers and manufacturing constraints. DRAM stores working data and is sold into servers, PCs, phones and accelerators. NAND flash stores data in solid-state drives, phones and other devices. HBM is a specialized, vertically stacked DRAM product installed beside AI accelerators. Enterprise SSDs use NAND but have different endurance, controller, qualification and capacity requirements from consumer storage.
| Market | Main demand examples | What can become constrained | Typical price signal |
|---|---|---|---|
| Conventional DRAM | PCs, phones and general servers | Wafer capacity, node transition yields and customer inventories | Contract prices plus a spot market for some modules and chips |
| Server DRAM | Cloud and enterprise servers | Large capacities per server, qualification and long-term allocations | Negotiated contracts, often by quarter or within price bands |
| HBM | AI and high-performance accelerators | Advanced DRAM dies, through-silicon vias, stacking, packaging and test | Product-specific negotiations; not interchangeable with ordinary DIMMs |
| NAND flash | Phones, PCs, removable storage and SSDs | Layer transitions, wafer output, controller supply and demand by drive class | Contract and spot prices that can diverge by grade and capacity |
| Enterprise SSD | Cloud databases, AI data sets and business storage | High-capacity NAND, firmware, endurance qualification and system integration | Longer customer programs and negotiated prices rather than a single NAND quote |
Because these pools are not perfectly interchangeable, a headline such as “RAM prices are rising” can hide opposite conditions in different products. A tight HBM allocation does not automatically create the same shortage in a consumer DDR5 module, although shared wafer, equipment, packaging and supplier decisions can transmit pressure.
#1 Best Overall

- Capacity per Module: 64MB
- Number of Pins: 72
- Type: EDO DRAM
- Form Factor: SIMM
- Manufacturer Warranty: Lifetime
Demand shocks: why AI has changed the mix
AI infrastructure requires much more memory per accelerator and per server than many traditional workloads. HBM supplies very high bandwidth next to an accelerator; server DRAM feeds CPUs and other system components; high-capacity storage holds training data, checkpoints and inference data. Cloud companies therefore compete for several memory products at once.
TrendForce estimated that memory products represented 47% of major cloud providers’ total capital expenditure in 2026 and projected 68% for 2027. Those figures are estimates and a projection published August 25, 2026, not audited spending totals. They show why a change in cloud investment can have an outsized effect on memory demand.
Supplier disclosures describe the allocation response. Samsung’s FY2025 results associated record memory revenue and operating profit with limited supply, strong conventional DRAM demand and expanded HBM sales, and identified HBM, server DDR5 and enterprise SSDs as high-value products. Micron’s 2026 SEC filing said generative AI, sovereign AI and workload migration were expanding cloud demand; it reported that AI and data-centric cloud servers require increasing DRAM, including HBM, and NAND, and that it shifted some DRAM supply toward data-center and hyperscale cloud markets in 2025. These are company accounts, so they document supplier strategy rather than serving as independent market measurement.
SK hynix reported on July 29, 2026 that AI-infrastructure investment was driving demand and price increases for high-performance AI-server products. It said customer demand exceeded its available supply, that it had multi-year agreements with around ten customers, and that it was planning capacity while maintaining capital-expenditure discipline. This is evidence from one supplier, not a statistic covering the entire industry.
Why more demand does not produce instant supply
Memory output is constrained by more than the number of wafer starts. A supplier must obtain cleanroom space, install tools, run a process, reach acceptable yields, qualify the product with customers and, for HBM, complete stacking and advanced packaging. A dollar of capital expenditure may increase bits per wafer, move production to a newer node, add NAND layers, improve yield or expand packaging instead of adding immediate greenfield wafer capacity.
| Publisher and outlook date | Product | 2025 capex | 2026 capex | Stated change | Qualification |
|---|---|---|---|---|---|
| TrendForce, November 13, 2025 | DRAM | US$53.7 billion | US$61.3 billion | About 14% year over year | Outlook figures, not realized totals |
| TrendForce, November 13, 2025 | NAND | US$21.1 billion | US$22.2 billion | About 5% year over year | Outlook figures, not realized totals |
TrendForce said in that November 13, 2025 outlook that cleanroom capacity remained constrained and that spending was focused on upgrades and high-value products. Consequently, aggregate capex growth could produce fewer immediately saleable bits than a simple spending comparison suggests. Packaging can be the bottleneck even when front-end wafer capacity exists.
How a memory price cycle develops
- Demand accelerates. A server refresh, AI build-out, phone launch or storage upgrade raises orders for a particular product class.
- Available inventory is checked first. Customers draw down stock and ask suppliers for more. If suppliers have little finished inventory or qualified output, lead times lengthen.
- Procurement becomes defensive. Cloud operators and other large buyers may sign longer commitments or reserve capacity. Smaller buyers can encounter allocations or higher quotes.
- Prices and margins rise. Contract prices are renegotiated within the relevant framework, while spot transactions can move faster because they reflect immediate availability.
- Investment and reallocation follow. Suppliers direct wafers, packaging and engineering resources toward products with better returns, while approving equipment, process and capacity projects.
- Supply eventually catches up—or demand pauses. Qualified output rises after the manufacturing delay. If customers have overbuilt inventory or end-market demand weakens, orders can fall abruptly and utilization and prices can reverse.
This sequence explains the recurring pattern without implying a fixed cycle length. The available evidence does not establish a complete historical inventory series or a reliable number of months from an inventory change to a price turning point.
Recommended Free Tools
Rank #2
Contract prices, spot prices and customer purchasing
There is no single “memory price.” Large customers commonly negotiate contracts, while spot activity reflects smaller, urgent or excess transactions. Contract terms can smooth or delay the visible effect of a shortage; spot quotes can jump first when immediately deliverable parts are scarce.
| Feature | Contract procurement | Spot-market activity |
|---|---|---|
| Time horizon | Monthly, quarterly or multi-year programs | Immediate or short-term transactions |
| Price formation | Negotiated; may be fixed, periodically reset or bounded by minimum and maximum prices | Responds quickly to current availability and urgency |
| Volume | Large planned commitments and customer qualification | Smaller, opportunistic or shortage-driven lots |
| Cycle effect | Can delay recognition of a turn, then reset at negotiation points | Can signal stress before contract data changes |
Micron describes strategic customer agreements with multi-year take-or-pay volume commitments. Its filing says contract prices may be fixed or periodically negotiated and that most such agreements include minimum and maximum price bands. TrendForce’s October 7, 2026 bulletin summary reported that suppliers and cloud providers signed multi-year server-DRAM agreements, with some supply under price-band mechanisms and the remainder negotiated quarterly. That summary establishes the stated arrangement, but it is not a substitute for the full report.
Inventory is the cycle amplifier
Customers do not order only for current consumption. They may build safety stock when they fear allocation, then defer purchases while using that stock. A supplier may also hold inventory, reduce output after a loss-making period or redirect wafers to another product. These decisions can make end demand look stronger or weaker than actual consumption.
For example, a cloud operator that expects an AI-server expansion may reserve several years of supply. The reservation can tighten the market before all servers are installed. Conversely, if a device maker bought aggressively during a shortage, a modest slowdown can produce weeks or months of no new orders while existing inventory is consumed. Prices then fall faster than end-user demand alone would suggest.
The Tool Desk
Outbyte Driver Updater FREEScan for outdated or missing drivers - takes under a minuteDriver Scan →Outbyte PC Repair FREEClear out junk files and repair common Windows errorsFree Scan →No common, comparable public series in the available evidence quantifies supplier and customer inventories together. Treat inventory commentary as directional unless a source defines the company, channel, date and measurement consistently.
Why DRAM, HBM and NAND can move differently
DRAM versus NAND
DRAM and NAND use different cell structures, process priorities and end markets. A server-DRAM shortage can coexist with weak consumer NAND demand, or NAND pricing can recover while conventional DRAM remains oversupplied. Capacity spending and bit growth must therefore be analyzed separately for each technology.
HBM versus conventional and server DRAM
HBM uses stacked dies, through-silicon vias and demanding packaging and test. It competes for engineering attention and some upstream resources but is not a drop-in replacement for ordinary server or consumer DRAM. Prioritizing HBM can leave less flexible capacity for conventional products even when total DRAM investment is increasing.
Rank #3
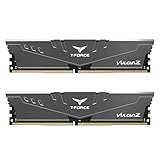
- Simple design to perfectly protect the cooling module with high thermal conductive adhesive
- Supports Intel & AMD motherboards
- Selected high-quality IC
- Supports XMP2.0
- Energy saving with ultra-low working voltage
Enterprise SSD versus other NAND
Enterprise SSDs require validated endurance, firmware, controllers, high capacities and customer qualification. Their demand can rise with AI and cloud storage even if phones or consumer PCs are weak. A quoted enterprise-SSD increase should not be presented as a universal price for every NAND component.
What’s actually slowing this PC down?
Pick the symptom - the matching free tool is one click away.
What the latest market estimates actually say
TrendForce reported that server-DRAM contract prices rose cumulatively 64% in the second half of 2025 and projected an additional approximately 270% increase during 2026. It also reported an approximately 35% enterprise-SSD price increase in the second half of 2025 and projected a cumulative 235% increase for 2026. These are TrendForce market-research estimates and forecasts published August 25, 2026; the 2026 numbers are not verified full-year outcomes and apply to the named product classes, not all memory.
Such large forecasts are useful for understanding the direction and severity of an analyst scenario, not for promising a result. Check the publication date, product definition, contract or spot basis and whether a figure is realized or projected before comparing it with a quote for a PC module or phone component.
How to read the cycle as a buyer or analyst
- Identify the product first: HBM, server DDR5, consumer DRAM, NAND wafers and enterprise SSDs have different balances.
- Separate contract from spot: a spot spike may precede a quarterly contract reset, while a contract can remain stable during short-lived spot volatility.
- Track procurement behavior: multi-year reservations, take-or-pay terms and customer pre-buys can tighten supply before consumption appears in shipments.
- Ask what capex buys: more bits, a process transition, higher NAND layers, HBM packaging or yield improvement have different timing.
- Check inventory direction: rising customer stock can support near-term orders but increase the risk of a later pause.
- Label the evidence: market-research estimates are not audited totals, and supplier disclosures reflect interested parties.
For a PC builder, market tightness can affect the price of a DDR5 desktop memory kit or a broader PC memory upgrade, but buying a kit is not a hedge against industry prices. Compare the capacity and compatibility you actually need rather than attempting to time a global memory cycle.
What this framework can—and cannot—predict
The framework reliably explains why prices can rise quickly, why AI changes product priority and why supply responds slowly. It does not provide a calendar date for the next peak or trough. The evidence summarized here lacks a complete historical inventory time series, a standardized lead-lag measurement and a single industry-wide forecast that covers every DRAM and NAND segment. Forecasts can also change when cloud budgets, device demand, yields or customer purchasing plans change.
The practical conclusion is to treat memory as a set of linked but distinct markets. Follow demand by application, qualified output rather than headline capex, contract terms, spot activity and inventory behavior together. When those signals point in opposite directions, a single “RAM price” headline is unlikely to describe the market you actually buy from.
Quick Recap
Product prices and availability are accurate as of the date/time indicated and are subject to change. Any price and availability information displayed on Amazon at the time of purchase will apply.

