
iTechGuides is reader-supported. When you buy through links on our site, we may earn an affiliate commission. As an Amazon Associate I earn from qualifying purchases. Learn more
AI data-center costs are not one line item. They combine land and construction, high-density computing equipment, electricity and cooling, grid or on-site power infrastructure, and the financing used to build everything. Technology companies and their tenants often pay directly for servers, leases and electricity. Developers, utilities, lenders and investors fund other portions. Whether households or other businesses ultimately share infrastructure costs depends on utility ownership, regulation, contracts and rate design—not simply on the presence of a data center.
The cost stack: five layers that should not be added blindly
A useful first step is to separate capital expenditure from operating expense and the building shell from the equipment installed inside it. A quoted cost per megawatt may cover only one of those layers. Adding figures with different scopes can produce a misleading total.

1. Land, site work and shell-and-core construction
This layer includes land, grading, the building structure, electrical rooms, basic mechanical systems and other site development needed before a tenant installs its computing systems. JLL’s 2026 Global Data Center Market Outlook estimates that average global shell-and-core construction cost rose from $7.7 million per megawatt in 2020 to $10.7 million per megawatt in 2025, with a 2026 forecast of $11.3 million per megawatt. These are market estimates, not guaranteed prices for a particular country, design or project.
The Tool Desk
Outbyte PC Repair FREERepair Windows errors before they cause bigger problemsFix Now →Outbyte Driver Updater FREEScan for outdated or missing drivers - takes under a minuteDriver Scan →Shell-and-core figures exclude the tenant’s technology fit-out. A data center can therefore appear affordable when measured as a building but become much more expensive once accelerators, servers, networking and specialized cooling are included.
2. Tenant technology fit-out
AI clusters require large numbers of GPUs or other accelerators, host servers, high-speed networking, storage, power-distribution equipment and controls. JLL estimates that AI technology fit-out can reach $25 million per megawatt, separate from shell-and-core construction. The estimate describes an upper-end market scale rather than a universal price: model choice, accelerator generation, utilization target, redundancy and procurement terms all change the amount.
3. Recurring electricity and cooling
Once the facility is operating, electricity is an ongoing expense rather than a one-time construction cost. The bill covers the computing load, pumps, fans, chillers or liquid-cooling systems, lighting and power losses. AI racks can concentrate far more power in a smaller footprint than conventional enterprise equipment, making cooling design and electrical capacity central to both operating cost and reliability.
No single per-query or per-facility operating cost can be inferred from the figures above. Electricity tariffs, climate, utilization, cooling architecture, hardware efficiency and contract terms vary too widely. A credible operating model must use the actual tariff and an engineering estimate of load over time.
4. Generation, transmission and interconnection
A large campus may need a new substation, transmission upgrades, a dedicated interconnection, firm capacity or temporary on-site generation. Batteries can provide backup or help manage peaks; gas or renewable generation may be built near the site. These assets can be paid for by the operator, a utility, a developer or a combination under a negotiated agreement.
JLL reports that the average wait for a grid connection in primary markets exceeds four years and says operators are pursuing on-site power and batteries. Its summary is a market assessment, not a timetable that applies to every location. In practice, the availability and date of power can determine whether a site is selected at all.
5. Financing and carrying costs
Companies may use cash capital expenditure, leases, joint ventures, project debt, private credit or other structures. Developers can finance the real estate while a technology tenant funds equipment. Interest, fees, insurance and construction-period carrying costs affect the final economics even when they do not appear in a construction estimate. Financing determines who supplies money and when; it does not, by itself, identify who ultimately bears the economic cost.
Rank #2

- Part number 900-53651-2500-000 and model: P3651
- This is the 2 slot version for when there is no empty slots between 2 slot cards. If you have one or more empty slots between the cards or the cards are 3 slot this NVLink will not work. See the attached images showing the card layout.
- NVLink 3.0 for any brand of RTX Ampere model graphics cards: 3090, A30, A40, A100 / H100 (Requires three NVLinks), A800, A4500, A5000, A5500, A6000
- This is the same as PNY part number: NVLAMP-2SLOT-BSP and RTXA6000NVLINK-KIT
- This is the same as Dell part number: 0RWJ7Y
Representative figures and what each one covers
| Figure | Scope | Geography, date and qualification |
|---|---|---|
| $7.7 million/MW | Average shell-and-core construction cost | Global JLL estimate for 2020 |
| $10.7 million/MW | Average shell-and-core construction cost | Global JLL estimate for 2025 |
| $11.3 million/MW | Forecast shell-and-core construction cost | Global JLL forecast for 2026 |
| Up to $25 million/MW | AI tenant technology fit-out | JLL estimate; separate from shell/core and not a universal project price |
| Up to $3 trillion by 2030 | Potential global sector investment | JLL 2026 outlook forecast, including different asset and fit-out categories |
JLL’s up-to-$3-trillion outlook combines approximately $1.2 trillion in real-estate asset value, roughly $870 billion in new debt financing and another $1 trillion to $2 trillion in tenant fit-out spending. Those categories and assumptions should remain attached to the forecast; they are not a measured final bill and should not be summed with unrelated per-megawatt figures.
Why power availability can cost as much as the building
AI developers are buying a path to dependable electricity, not merely a parcel of land. Interconnection studies, transmission construction, transformer procurement and permitting can take years. A site with a finished building but no firm power cannot run a production cluster, so delay creates lost revenue and may force a more expensive interim solution.
JLL describes “speed to power” as the primary criterion driving site selection, followed by community support, latency and proximity to customers. That ordering explains why operators consider on-site generation, batteries, phased energization and locations near existing substations. Each option trades capital cost, operating cost, emissions profile, reliability and permitting risk differently.
Contractual renewable-energy purchases add another distinction. An operator may claim a renewable match through contracts while the physical electricity flowing through the local grid comes from a mixed generation fleet. The IEA treats those contractual claims separately from the physical electricity consumed, so a sustainability label should not be confused with the local grid’s actual mix.
How much electricity the buildout could require
The International Energy Agency’s 2025 base case projects global electricity generation for data centers to rise from 460 TWh in 2024 to more than 1,000 TWh in 2030 and 1,300 TWh in 2035. These are global projections, not a forecast for a particular company or country.
Windows Errors? Fix Them Before They Spread
Repair common Windows errors and clear accumulated junk for a smoother, more stable PC - no reinstall needed.Free scan · no reinstallCrashes, No Sound, or Screen Glitches?
Random freezes, missing sound and display glitches usually trace back to one bad driver. Find and replace yours safely.Free scan · under a minuteFor the additional demand through 2030, the IEA expects renewables to supply nearly half. Natural gas and coal together supply more than 40% of the increase in that period in the base case. The mix matters for fuel costs, emissions, transmission needs and energy-security policy, but it does not provide a universal electricity price for an individual data center.
Rank #3
- Video/Sound Cards
- Passive Cooling
At the project level, the important inputs are maximum load, average load, operating hours, tariff structure, demand charges, backup requirements and the price of any dedicated generation or storage. Two facilities with the same IT capacity can have very different annual bills if they operate at different utilization levels or connect under different utility tariffs.
Who pays for each part?
Technology companies and cloud tenants
The company operating an AI service generally pays for accelerators, servers, networking and software, either directly or through a lease or cloud contract. It may also pay the utility bill, a capacity reservation charge, connection fees and part of a dedicated power project. A tenant’s contract can shift construction or equipment ownership to a landlord, but the economic cost still has to be recovered from someone using the facility.
Data-center developers and landlords
Developers commonly fund land, shell construction and shared mechanical and electrical systems. They recover those costs through rent, capacity reservations and development fees. If a tenant supplies its own equipment, the landlord’s investment is smaller; if the landlord delivers a fully fitted campus, the lease rate reflects more capital and risk.
Utilities and power-project owners
A utility may build substations, transmission or generation and recover the investment through charges approved by its regulator. An independent power producer or a data-center consortium may instead own generation under a bilateral contract. Ownership determines who raises capital, while the contract and tariff determine how payments flow over time.
Lenders, private-credit funds and investors
Debt providers and equity investors supply capital before a facility earns revenue. They receive interest, fees, dividends or asset value in return and bear risks such as construction delays, hardware obsolescence, vacancy and power-price volatility. Their participation spreads payments across the project’s life rather than eliminating the underlying cost.
Other electricity customers
Other customers can be affected when a utility expands generation or the grid and recovers those costs through a broader rate base. They may instead be insulated by a special tariff, a customer-funded upgrade or a contract that assigns costs to the data-center customer. The answer depends on local regulation and utility ownership; it is not safe to say that every household pays for every facility.
Rank #4

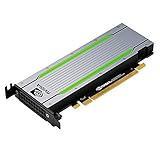
- CUDA Cores: 4608 / NVIDIA Tensor Cores: 576 / NVIDIA RT Cores: 72
- GPU Memory: 24 GB GDDR6 with ECC / Bandwidth: 624 GB/Sec
- System Interface: PCI Express 3.0 x16
- Four DisplayPort 1.4 Connectors
- 3D Stereo Support with Stereo Connector
What U.S. evidence says about retail electricity prices
A 2026 MIT Center for Energy and Environmental Policy Research working paper by Robyn Meeks, Jacquelyn Pless, Zhiyuan Qi and Zhenxuan Wang examined U.S. data-center entry from 2010 through 2024. It reports an average 2.7% increase in retail electricity prices after entry, with estimated effects of 2.1% for residential customers, 2.8% for commercial customers and 4.2% for industrial customers.
The average concealed major institutional differences. Investor-owned utilities showed a 5.6% average retail-price increase, while publicly owned utilities had much smaller effects and cooperatives had no effect reported in the study. The authors connect those differences to regulatory and market structures. These are historical statistical results across the study’s locations, not proof that one named facility caused a particular bill increase or a forecast for every region.
The paper’s central institutional point is that “who pays for that investment depends on the institutions that finance, regulate, and allocate its costs.” A bill impact therefore requires examining the utility’s ownership, approved rate case, connection agreement, demand charges and treatment of new generation or transmission—not just the facility’s electricity consumption.
Financing scenarios as AI demand outgrows internal cash
An NBER Working Paper 35865 scenario by Stijn Van Nieuwerburgh describes a U.S. buildout reaching 188 GW by 2032 and requiring nearly $9 trillion of total investment. That is a scenario estimate, not an enacted program or certain outcome.
The paper describes financing broadening toward leases, joint ventures, project debt, private credit, securitization and special-purpose vehicles as investment needs exceed what technology companies can fund from internal cash. Each structure changes control, repayment timing and risk allocation:
What’s actually slowing this PC down?
Pick the symptom - the matching free tool is one click away.
- Leases let a tenant pay for capacity over time while an owner carries more asset risk.
- Joint ventures combine capital and may divide development, technology and power responsibilities.
- Project debt is repaid from contracted project cash flow and is sensitive to completion and utilization.
- Private credit can move quickly but may carry higher pricing or tighter protections than conventional bonds.
- Securitization and special-purpose vehicles can separate assets or contracts from a parent company, making the legal and financial allocation more complex.
None of these mechanisms proves that customers, taxpayers or utility ratepayers bear a cost. To answer that question, trace the cash flow from the final user or electricity customer through the lease, tariff and financing documents.
A practical framework for analyzing a proposed project
- Define the capacity measure. Establish whether “megawatts” means utility interconnection capacity, building power, cooling capacity or IT load. They are not interchangeable.
- Separate the budget. Put land and shell/core, tenant fit-out, power infrastructure, operating costs and financing in distinct lines.
- Identify the power path. Record the connection date, substation and transmission work, firm-capacity terms, backup generation and battery ownership.
- Read the tariff and contracts. Look for demand charges, minimum payments, connection contributions, curtailment rights and who pays for overruns.
- Map the utility institution. Determine whether the provider is investor-owned, publicly owned or cooperative and which regulator approves cost recovery.
- Test utilization and price sensitivity. Model low, expected and high utilization with the actual tariff rather than applying a generic per-query number.
- Keep physical and contractual electricity separate. Report the local generation mix and any renewable-energy contracts as different facts.
- Label forecasts and scenarios. Mark JLL, IEA and NBER figures as estimates or projections and preserve their geography and date.
Common mistakes when discussing AI data-center costs
- Combining incomparable numbers: shell/core, fit-out, annual electricity and financing are different categories.
- Calling a forecast a bill: JLL and IEA figures describe expected markets under stated assumptions.
- Assuming a direct household charge: price effects depend on rate design and utility institutions.
- Treating connection capacity as consumption: reserved megawatts can exceed average operational load.
- Ignoring delay: a four-year average connection wait in JLL’s primary-market assessment can change project value and interim power costs.
- Equating renewable contracts with physical supply: contractual matching does not describe every electron serving the facility.
- Using one global number for every site: climate, land, labor, tariffs, permitting and network architecture create regional variation.
Bottom line
AI data centers are expensive because they combine a costly building with unusually expensive computing equipment and a power system capable of delivering dense, reliable electricity. The operator or tenant usually pays directly for much of the equipment and energy, while developers, utilities, lenders and investors finance other layers. The broader public bears costs only where contracts, regulation and rate design allocate them that way. The most reliable answer to “who pays?” is therefore a traced project cash flow—not a blanket claim about households or technology companies.
Quick Recap
Product prices and availability are accurate as of the date/time indicated and are subject to change. Any price and availability information displayed on Amazon at the time of purchase will apply.

