
iTechGuides is reader-supported. When you buy through links on our site, we may earn an affiliate commission. As an Amazon Associate I earn from qualifying purchases. Learn more
To optimize LLM inference, measure a representative workload, find the bottleneck, change one relevant setting at a time, and measure again. CUDA and ROCm offer different runtimes and profiling tools, but the available documentation does not establish that one platform is universally faster.
What does GPU optimization mean for LLM inference?
LLM inference has distinct stages and performance goals. Prompt processing, or prefill, handles the input context; token generation, or decode, produces the response. A setup that improves throughput under concurrent requests may not reduce the time an individual user waits for the first token. Decide which outcome matters before tuning.
- Time to first token (TTFT): how long a request waits before generation begins.
- Decode latency: how quickly the model produces subsequent tokens.
- Throughput: how much work the system completes over time, often reported as tokens per second. State whether this is per request or aggregated across concurrent requests.
Optimization can involve serving settings, precision, runtime choices, or kernels. The best change depends on the model, GPU, software release, input and output lengths, and concurrency. A result from one setup is not a general ranking of CUDA against ROCm.
What’s actually slowing this PC down?
Pick the symptom - the matching free tool is one click away.
How should you measure and tune an inference workload?
-
Define a representative workload
Record the model and architecture, representative prompt and output lengths, request concurrency or batch size, and the metric you need to improve. Include the intended operating pattern: a single interactive request and a busy serving workload can stress the system differently.
#1 Best Overall
Sale HPE NVIDIA Tesla V100 32GB HBM2 PCIe 3.0 x16 Passive GPU Computational Accelerator for AI Machine Learning HPC Deep Learning 699-2G500-0216-400 (Renewed)
- NVIDIA Volta GV100 Architecture — 4,608 CUDA Cores, 640 1st-Gen Tensor Cores delivering 14 TFLOPS FP32 and 112 TFLOPS deep learning performance for AI training, inference, HPC, and scientific computing workloads
- 32GB HBM2 ECC Memory — 900 GB/s Bandwidth — High-bandwidth memory on a 4096-bit bus with ECC error correction provides the memory capacity and throughput required for the largest AI models, simulations, and datasets
- PCIe 3.0 x16 Interface — 250W TDP — Standard PCIe Gen3 connectivity with passive cooling designed for enterprise rack server deployment in HPE ProLiant, Dell PowerEdge, and Supermicro platforms with adequate chassis airflow
- NVLink — Scale to 96GB Unified Memory — Connect two V100 GPUs via NVLink at 300 GB/s bi-directional bandwidth to scale GPU memory from 32GB to 96GB for larger AI training and HPC workloads
- Multi-Precision Computing — Supports FP64 (7 TFLOPS), FP32 (14 TFLOPS), FP16 (112 TFLOPS) and INT8 precision modes for flexible deployment across training, inference, and scientific simulation workloads
-
Establish a repeatable baseline
Run the same workload more than once and record the GPU, software versions, precision, serving configuration, and measurement method. Keep the environment stable. NVIDIA warns that changing GPU clocks or throttling can make timing measurements and TensorRT tactic selection unstable; its performance benchmarking guide describes timing and environment controls.
-
Start with the system timeline
Determine whether time is dominated by CPU work, kernel launches and dispatch, GPU computation, or data movement before trying to optimize a specific kernel. NVIDIA documents Nsight Systems for viewing CUDA activity and transfers; AMD recommends beginning with system-level profiling rather than jumping immediately to low-level traces. See AMD’s guide to choosing a ROCm profiling tool.
-
Narrow the investigation
Once the timeline identifies a likely bottleneck, inspect the relevant layers or kernels. NVIDIA’s TensorRT benchmarking material covers TensorRT profiling and Nsight Systems; AMD distinguishes system-, kernel-, and instruction-level analysis, including tools such as rocprofiler-systems, rocprofiler-compute, and
rocprofv3. Use deeper traces only when the broader evidence points to them.Special offer. See more information about Outbyte and uninstall instructions. Please review EULA and Privacy policy. -
Change one variable and validate
Test a change that addresses the observed bottleneck: for example, batching, a serving backend, graph use, precision, or a kernel choice. Keep the model and workload fixed, rerun the same measurements, and check output correctness. If reducing precision or quantizing, also validate task quality; a faster result alone does not establish that the change is acceptable.
NVIDIA summarizes its performance approach as “The most important optimization is to compute as many results in parallel as possible using batching.” Treat batching as a hypothesis to test, not a guarantee: it can increase parallel work, but the useful setting depends on workload and latency goals. AMD likewise advises an iterative profiling-and-validation process in its Instinct workload optimization guidance.
Which profiling tools fit CUDA and ROCm?
| Investigation depth | CUDA path | ROCm path |
|---|---|---|
| System activity and transfers | Nsight Systems; NVIDIA’s benchmarking guide also covers CUDA events and wall-clock timing. | rocprofiler-systems, recommended as the system-level starting point by AMD’s profiler-selection guide. |
| Layers and kernels | TensorRT profiling and CUDA kernel inspection, as covered in NVIDIA’s benchmarking documentation. | ROCm Compute Profiler (rocprofiler-compute) for kernel-level utilization and bottleneck analysis. |
| More detailed traces | Use the timing and profiling methods in the NVIDIA benchmarking guide to investigate the identified issue. | rocprofv3 and ROCprof Compute Viewer are among AMD’s tools for deeper profiling, when kernel-level evidence warrants it. |
The table describes tool roles, not equivalent features or a performance comparison. AMD’s tool-selection documentation recommends moving from system-level investigation toward kernel and instruction analysis as the bottleneck becomes clearer. NVIDIA’s benchmarking guide covers its measurement and profiling methods.
Rank #2
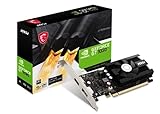
- Chipset: NVIDIA GeForce GT 1030
- Video Memory: 4GB DDR4
- Boost Clock: 1430 MHz
- Memory Interface: 64-bit
- Output: DisplayPort x 1 (v1.4a) / HDMI 2.0b x 1
What can you tune in a CUDA inference stack?
NVIDIA’s TensorRT guidance recommends measuring before optimizing, then testing changes that suit the workload. Relevant areas include batching, CUDA graphs, multi-streaming, layer fusion, Tensor Core alignment, precision, and tactic selection. These are options to evaluate, not settings that should all be enabled together.
Recommended Free Tools
- Batching: test whether processing more work in parallel improves the metric that matters. Measure latency as well as throughput so a throughput gain does not conceal an unacceptable wait for individual requests.
- CUDA graphs and streams: investigate them when the profile suggests launch or scheduling overhead, or when the workload can benefit from concurrent work. Confirm behavior for the model and runtime configuration you actually use.
- Fusion, alignment, and tactics: use profiling and TensorRT’s engine-building results to find whether layer execution or kernel choices are limiting the workload. NVIDIA notes that timing-cache use can reduce repeated engine-build profiling work; lowering the builder optimization level can shorten builds at a possible cost to final engine performance.
- Precision: test supported precision choices against both performance and model-quality requirements. Record the actual precision used rather than reporting only the runtime or GPU.
TensorRT-LLM documentation describes a Python API for defining LLMs, building optimized TensorRT engines, and running them through Python and C++ runtimes. Its documentation lists capabilities including multi-GPU and multi-node support, in-flight batching, paged KV cache, and quantization options. Check the documentation for the specific release you intend to deploy; feature availability is version-dependent.
For broader TensorRT performance guidance, see NVIDIA’s optimization documentation. It explains the trade-offs involved in tactics, build optimization, and performance tuning rather than promising one setting will improve every engine.
What should you check when tuning ROCm inference?
ROCm inference tuning is also model- and GPU-specific. AMD’s vLLM V1 optimization guide discusses selecting attention backends for different model types, enabling AITER for supported paths, and tuning serving parameters according to latency or throughput goals. Backend support and flags vary by model family and GPU, so verify compatibility and the exact instructions for the ROCm, vLLM, and hardware versions in your deployment.
-
Confirm the supported path
Check whether the intended GPU, model type, and software release support the attention backend or AITER path you plan to use. Do not assume a flag documented for one model family applies to another.
Special offer. See more information about Outbyte and uninstall instructions. Please review EULA and Privacy policy. -
Choose the serving objective
Set up the workload around either latency or throughput needs, then benchmark the relevant serving parameters. Keep prompt lengths, output lengths, and concurrency consistent between baseline and tuned runs.
Rank #3
Sale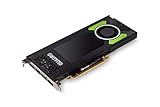 PNY NVIDIA Quadro P4000
- This Quadro P4000 is based on NVIDIA Pascal architecture and delivers up to 70% more performance than the NVIDIA maxwell-based Quadro M4000, system interface - PCI Express 3.0 x16
- With greater Graphics performance you can work with large models, scenes, and assemblies with improved interactive performance during design, visualization, and simulation.
- The P4000 is the most powerful, single slot VR Ready Professional visual computing solution.
- Tuned and tested drivers with support for the latest releases of OpenGL, DirectX, Vulkan, and NVIDIA CUDA ensure compatibility with the latest versions of professional applications.
- Creation and playback of HDR video H.264/hevc decode and encode engines.Supported platforms: Microsoft Windows 10 (64- and 32-bit), Microsoft Windows 8.1 and 8 (64- and 32-bit), Microsoft Windows 7 (64- and 32-bit), Microsoft Windows Server 2008 (64- and 32-bit), Microsoft Windows Server 2012, Microsoft Windows Server 2012 R2 64, Microsoft Windows Server 2016, Linux – Full OpenGL implementation, complete with NVIDIA and ARB extensions (64- and 32-bit)
-
Check fallback behavior
Verify which backend actually runs and whether the software uses a fallback for an unsupported combination. A configured option is not proof that the intended optimized kernel was selected.
AMD’s vLLM V1 performance optimization guide includes backend-relative examples, but its reported gains are specific to the model, backend, and benchmark conditions described there. They are not independent CUDA-versus-ROCm results and should not be treated as a general speed advantage.
Independent reader supportYour contribution helps us test, update, and keep practical guides available for everyone.How can you make a fair CUDA-versus-ROCm comparison?
Compare complete configurations under the same workload, not platform names in isolation. Use the same model and architecture, prompt and output lengths, concurrency, and latency or throughput definition. Report differences that cannot be held constant instead of hiding them.
| What to disclose | Why it matters |
|---|---|
| GPU model and memory | Identifies the hardware and its memory capacity for the tested run. |
| Model, runtime, framework, and versions | Defines the software path and makes release-specific behavior visible. |
| Precision or quantization | Performance and output quality can change with the numerical format. |
| Attention and GEMM backends | Backend choices can change which kernels execute. |
| Prompt length, output length, batch or concurrency | Defines how much prefill and decode work the system performed and how much could run in parallel. |
| TTFT, decode latency, and throughput | Shows whether the comparison concerns responsiveness, generation speed, total capacity, or more than one of these. |
| Memory use, build time, and operational constraints | Captures costs beyond the headline speed result, including compatibility and deployment considerations. |
Use the same measurement method where possible, repeat runs, and note clock instability or throttling. If the software stacks require different settings, disclose them; the goal is a useful comparison of actual configurations, not a claim that a single setting is equivalent across platforms.
How should you interpret published performance examples?
Vendor documentation is useful for discovering supported features and promising configurations, but benchmark results are conditional. AMD’s vLLM guidance reports backend-relative token-per-second improvements, including a 2.7–4.4× comparison for one MHA backend and a 15–20% decode improvement under a stated KV-cache layout and concurrency condition. Those figures describe the documented backend comparisons, not an independent cross-vendor test. Consult the page’s current version and exact benchmark setup before applying a number to another model or deployment.
A meaningful conclusion for your system comes from the measured workload, disclosed conditions, and correctness checks—not from carrying over a result whose GPU, model, backend, or serving pattern differs.
Quick Recap
Product prices and availability are accurate as of the date/time indicated and are subject to change. Any price and availability information displayed on Amazon at the time of purchase will apply.

