
The Tool Desk
Outbyte PC Repair FREERepair Windows errors before they cause bigger problemsFix Now →Outbyte Driver Updater FREEFix the driver behind crashes, sound loss and screen glitchesFind Drivers →iTechGuides is reader-supported. When you buy through links on our site, we may earn an affiliate commission. As an Amazon Associate I earn from qualifying purchases. Learn more
Software can materially reduce the energy used by AI inference, but no single technique fixes the problem and the evidence does not show how many teams have adopted these measures. Microsoft Research models an 8–20× combined reduction from better model design, serving systems and hardware; a Nature Energy field demonstration achieved a 25% power reduction for three hours on a 256-GPU cluster; and Google Cloud reports 0.24 watt-hours for a median Gemini Apps text prompt. Those figures describe different systems, boundaries and methods, so they are not interchangeable benchmarks.
What the software fix actually means
AI inference is the process of running a trained model to produce an answer. Its energy footprint is not limited to the accelerator chips doing matrix calculations. A complete accounting can include accelerator energy, host CPU and memory, networking, storage, cooling, power-conversion losses and the electricity consumed by capacity that is powered on but waiting for work.

Software affects nearly every part of that chain. Model architecture determines how many operations and tokens must be processed. Quantization changes the numerical representation used by those operations. Serving software decides how requests are batched, routed and kept on accelerators. Schedulers can delay flexible jobs or place them where capacity is available. Idling controls can turn down unused resources instead of leaving them at full power. Measurement software determines whether operators see only accelerator energy or the broader facility cost.
That is why “energy per prompt” is useful only when its boundary and workload are stated. A short text completion, a long reasoning session and an autonomous agent making many tool calls can have radically different work profiles. The same model can also consume different amounts of electricity at different utilization levels, hardware generations and data-center sites.
#1 Best Overall
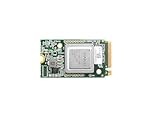
- ✅Powered by 26 Tera-Operations Per Second (TOPS) Hailo-8 AI Processor. 2.5W typical power consumption
- ✅Scalable, enabling simultaneous processing of multi-streams & multi-models
- ✅Enabling real-time, low latency and high-efficiency AI inferencing on the edge devices
- ✅Supports TensorFlow, TensorFlow Lite, ONNX, Keras, Pytorch frameworks
- ✅Supports Linux and Windows. Supports the temperature range of -40°C to 85°C
There is no universal watt-hour figure for a prompt
Two recent estimates illustrate why comparisons require care.
| Source and date | Reported figure | What it covers | Important qualification |
|---|---|---|---|
| Microsoft Research, April 2026 | 0.31 Wh median per query; interquartile range 0.16–0.60 Wh | Optimized frontier-scale inference under the paper’s assumptions | An estimate for a defined configuration, not a universal value for every model or provider |
| Google Cloud, using May 2025 data | 0.24 Wh for a median Gemini Apps text prompt | Google’s stated boundary includes idle capacity, host CPU and RAM, and data-center overhead | A point-in-time company estimate that Google says was not independently verified |
The 0.24 Wh and 0.31 Wh numbers should not be treated as a head-to-head ranking. They refer to different services, dates, measurement methods and system boundaries. Microsoft’s figure is a modeled estimate for optimized frontier-scale inference. Google’s figure is a provider-specific accounting for a median text prompt and includes overhead that some accelerator-only measurements omit.
Google also reports that the median Gemini Apps text prompt used 33 times less energy and had a 44-times lower total carbon footprint in a comparison of May 2025 with May 2024. Those are Google’s own year-over-year figures, not an independent industry benchmark. The comparison reflects changes in the service and its infrastructure as well as the measurement period, so it should not be generalized to other providers.
Do these 3 things before closing this tab:
1Scan for outdated or missing drivers - takes under a minute2Clear out junk files and repair common Windows errors3Fix the driver behind crashes, sound loss and screen glitchesWhere software can reduce inference energy
Model design
Model design is the first leverage point because it sets the amount of computation required for every request. A model can be tailored to a task instead of using the largest available system for every query. Distillation, sparsity, routing among specialized components and architectures that produce fewer unnecessary tokens are examples of design choices that can reduce work. Each choice introduces quality, coverage or maintenance trade-offs, so the right target is the smallest model that meets a documented accuracy requirement.
Microsoft Research includes model-design advances in its modeled 8–20× combined reduction potential. That range represents a scenario in which several layers improve together; it is not a promise that replacing one model will deliver an 8× or 20× reduction for a particular application.
Quantization and numerical efficiency
Quantization uses lower-precision numerical formats where the loss in accuracy is acceptable. Fewer bits can reduce memory movement and allow hardware to perform more operations per joule. Google Cloud lists quantization as one element of its inference-efficiency work. The practical question is not whether a lower-precision model is theoretically cheaper, but whether it preserves the quality, safety and language coverage that the application requires.
Teams should validate quantized versions against a fixed evaluation set and monitor production error rates. A small energy saving that causes retries, longer prompts or human review can erase its benefit. Record the numerical format, calibration data, model version and evaluation results so that an energy comparison remains reproducible.
What’s actually slowing this PC down?
Pick the symptom - the matching free tool is one click away.
Rank #2

- Powered by 26 Tera-Operations Per Second (TOPS) Hailo-8 AI Processor.
- 2.5W typical power consumption
- Enabling real-time low latency and high-efficiency AI inferencing on the edge devices
- Supports TensorFlow TensorFlow Lite, ONNX, Keras, Pytorch frameworks
- Supports Linux and Windows.
Serving systems
Serving software controls how model requests are executed. Efficient batching can keep an accelerator busy with several compatible requests instead of repeatedly launching small jobs. Request routing can send simple tasks to a smaller model and reserve a larger model for cases that need it. Prefix or response caching can avoid recomputing identical work when the application permits it. Compiler and kernel optimizations can reduce overhead in the operations that dominate a model’s runtime.
These techniques interact with latency and privacy requirements. Batching may increase the wait for the first request in a group. Caching may be inappropriate for personalized or sensitive outputs. Routing can create inconsistent behavior unless the fallback policy is explicit. Measure energy together with tail latency, error rate and user-visible quality rather than optimizing a single dashboard number.
Dynamic idling and capacity management
Inference fleets are often provisioned for bursts, which leaves some capacity underused between peaks. Dynamic idling reduces power draw from resources that are not needed immediately and wakes them as demand rises. Google Cloud identifies dynamic idling and broader software-stack work as parts of its approach.
Idling is not free. Frequent power-state changes can add wake-up latency, and overly aggressive shutdown policies can cause capacity shortages during a burst. Set a latency budget, define a minimum warm pool and test recovery time under realistic traffic patterns. Report whether an energy figure includes the idle capacity that the policy is designed to reduce.
Workload coordination can lower peak power without new hardware
A Nature Energy field demonstration in 2025 showed the value of coordinating workloads on existing infrastructure. On a 256-GPU cluster in Phoenix, the operators reported a 25% power reduction for three hours during a peak-demand period while maintaining their AI quality-of-service guarantees.
The result is bounded to that cluster, location, three-hour event and service policy. It does not establish a permanent 25% reduction in total energy, nor does it show that every workload can be shifted or slowed by the same amount. Peak-power management and total-energy reduction are related but different objectives: moving flexible work away from a peak can reduce demand charges or grid stress even if the same number of computations is eventually performed.
For a production team, workload coordination starts by labeling jobs according to urgency. Interactive requests usually have strict latency limits. Batch embedding, evaluation, retraining and offline data processing may have a completion window instead. A scheduler can then place flexible work in lower-demand periods or on less-loaded resources, subject to data locality, deadlines and availability requirements.
Rank #3

- NVIDIA Volta GV100 Architecture — 4,608 CUDA Cores, 640 1st-Gen Tensor Cores delivering 14 TFLOPS FP32 and 112 TFLOPS deep learning performance for AI training, inference, HPC, and scientific computing workloads
- 32GB HBM2 ECC Memory — 900 GB/s Bandwidth — High-bandwidth memory on a 4096-bit bus with ECC error correction provides the memory capacity and throughput required for the largest AI models, simulations, and datasets
- PCIe 3.0 x16 Interface — 250W TDP — Standard PCIe Gen3 connectivity with passive cooling designed for enterprise rack server deployment in HPE ProLiant, Dell PowerEdge, and Supermicro platforms with adequate chassis airflow
- NVLink — Scale to 96GB Unified Memory — Connect two V100 GPUs via NVLink at 300 GB/s bi-directional bandwidth to scale GPU memory from 32GB to 96GB for larger AI training and HPC workloads
- Multi-Precision Computing — Supports FP64 (7 TFLOPS), FP32 (14 TFLOPS), FP16 (112 TFLOPS) and INT8 precision modes for flexible deployment across training, inference, and scientific simulation workloads
- Define service classes: document maximum latency, completion deadlines and acceptable interruption for each workload.
- Expose flexibility to the scheduler: supply earliest-start and latest-finish times for jobs that can move.
- Protect interactive capacity: reserve a warm pool and enforce quality-of-service limits before admitting batch work.
- Measure the correct outcome: track peak power, total energy, latency and completed work separately.
Why long reasoning and agentic requests change the calculation
A short answer is not a reliable proxy for a reasoning-heavy task. Microsoft Research estimates that long reasoning and agentic queries can consume more than an order of magnitude more energy in some conditions. The paper attributes this to increased token generation and reduced serving concurrency: the system performs more sequential work and has fewer opportunities to keep hardware efficiently shared among requests.
This has two implications. First, teams should report energy by workload class rather than publishing one blended average. Second, product design can be an energy intervention. Limit unnecessary chain-of-thought length, stop tool loops when a task is complete, use smaller models for intermediate steps and require escalation to a larger model only when a confidence or quality check fails. Any such policy must be evaluated for accuracy and safety; reducing tokens by causing wrong answers or repeated attempts is not a real saving.
How to build an energy-reduction program
1. Set the measurement boundary
Write down what is included before changing the system. At minimum, distinguish accelerator-only energy from full-system energy. A full-system boundary may include host CPU and RAM, networking, storage, cooling and other data-center overhead. Google’s 0.24 Wh estimate explicitly includes idle capacity, host CPU and RAM, and data-center overhead, which makes it different from a chip-only reading.
Record the region, hardware, model version, software stack, traffic mix and measurement period. Carbon calculations require an additional emissions factor and should be reported separately from watt-hours because the grid mix varies by location and time.
2. Establish workload-level baselines
Group requests by model, input length, output length, reasoning mode, tool use and latency class. Report median and tail latency, successful completions, retries and energy per completed task. A single average can hide a small number of expensive agentic jobs or make a heavily cached workload look better than an uncached one.
3. Match the intervention to the constraint
| Observed constraint | Software option | Primary metric | Risk to test |
|---|---|---|---|
| High computation per request | Smaller task-specific model, distillation or selective routing | Energy per successful task | Accuracy, safety and escalation rate |
| Memory and data-movement overhead | Quantization and numerical-format optimization | Energy and throughput at equal quality | Quality regression and calibration failures |
| Low or bursty utilization | Dynamic idling and request batching | Idle power, utilization and tail latency | Wake-up delay and capacity shortfall |
| Predictable flexible jobs | Workload coordination and deadline-aware scheduling | Peak power and completed work | Missed deadlines or interference with interactive traffic |
| Long reasoning sessions | Token limits, loop controls and staged model escalation | Energy per resolved case | Lower answer quality or more retries |
4. Test quality and service guarantees together
Use a fixed evaluation set for model changes and a replay or shadow test for serving changes. Include worst-case input lengths and peak traffic, not only the median. Define guardrails for accuracy, refusal behavior, latency, availability and data isolation. The Nature Energy demonstration is notable because its reported power reduction was achieved while maintaining quality-of-service guarantees; that condition is essential when interpreting any operational saving.
5. Roll out with a reversible policy
Start with a limited traffic slice or a noninteractive batch queue. Keep the previous model and serving configuration available for rollback. Compare energy per completed task, not merely instantaneous power, and watch for retries, queue growth and increased human intervention. Expand only when the quality and reliability budgets remain intact.
Independent reader supportYour contribution helps us test, update, and keep practical guides available for everyone.How to interpret the modeled 8–20× potential
Microsoft Research’s 8–20× figure is a combined modeled potential from advances in model design, serving systems and hardware. It describes what could happen when several improvements compound under the paper’s assumptions. It is not a measured result from one production deployment and should not be presented as the expected saving from a software update.
Modeled potential is still useful for prioritization. It signals that energy is determined by a stack of choices rather than by hardware alone. To turn that signal into an operating target, an organization must substitute its own model, traffic, service limits and measurement boundary, then report the observed change and its uncertainty.
Quick wins for a faster PC:
Clear out junk files and repair common Windows errorsFree Scan →Fix the driver behind crashes, sound loss and screen glitchesFind Drivers →Repair Windows errors before they cause bigger problemsFix Now →What data-center operators should do first
- Instrument the full path: collect accelerator, host, facility and idle-capacity data at a time resolution that captures traffic peaks.
- Separate power from energy: use power for grid and capacity planning, and energy per completed task for efficiency comparisons.
- Publish workload definitions: identify prompt length, generated tokens, reasoning mode and tool calls behind every reported average.
- Coordinate with the grid and site: test deadline-aware scheduling during peak periods, while preserving interactive service guarantees.
- Automate regression checks: block releases that exceed energy, latency or quality budgets without an approved exception.
Software cannot remove the need for efficient hardware, reliable power and adequate cooling. It can make existing resources do less unnecessary work, keep them busy when work is available and reduce the amount of capacity drawing power while idle. The largest gains usually come from treating those controls as one system instead of optimizing a model, a scheduler or a data center in isolation.
Common mistakes that make savings look larger than they are
- Comparing unlike boundaries: an accelerator-only number will generally not match a full-facility accounting.
- Calling a point estimate universal: Google’s 0.24 Wh figure is for a median Gemini Apps text prompt using May 2025 data, not every prompt or provider.
- Conflating peak and total energy: the Phoenix demonstration reduced power for three hours; it did not establish a corresponding lifetime reduction in energy.
- Ignoring output length: long reasoning and agentic requests can require more than an order of magnitude more energy in some conditions.
- Trading away quality: a lower-energy response that triggers retries or review may increase energy per successful outcome.
- Assuming adoption rates: the available evidence demonstrates techniques and potential, but it does not establish what share of AI teams use them.
What the evidence says about adoption
The claim that most teams are not using software efficiency measures cannot be quantified from the cited sources. Microsoft Research models future improvement potential, Google Cloud describes its own infrastructure work, and the Nature Energy paper reports one field demonstration. None provides a representative survey or deployment census. The defensible conclusion is narrower: software interventions are technically available, their benefits can be measured, and adoption prevalence remains an open question.
Organizations deciding whether to act do not need an industry-wide adoption percentage. They can measure their own baseline, choose a workload with clear service limits and run a reversible test. That approach distinguishes a demonstrated local saving from a modeled possibility and prevents a provider-specific figure from becoming a misleading promise.
Frequently Asked Questions
Why can’t I multiply a watt-hour-per-prompt estimate by my monthly prompt count?
You can make a rough internal estimate only after matching the estimate’s model, prompt and output lengths, utilization, energy boundary and measurement date to your workload. Long reasoning, retries and tool calls can make the real value substantially different.
Recommended Free Tools
Does the 25% Phoenix result mean every AI data center can cut power by 25%?
No. Nature Energy reported that reduction for three hours on a specific 256-GPU cluster in Phoenix while maintaining its service guarantees. It demonstrates the possibility of coordinated peak-power management, not a universal savings rate.
What should a small team implement first?
Start with workload-level measurement and routing: identify which requests truly need the largest model, set token and tool-loop limits, and test quantization or batching against fixed quality and latency thresholds. Expand to scheduling and dynamic idling once the baseline is trustworthy.
Quick Recap
Product prices and availability are accurate as of the date/time indicated and are subject to change. Any price and availability information displayed on Amazon at the time of purchase will apply.

