
iTechGuides is reader-supported. When you buy through links on our site, we may earn an affiliate commission. As an Amazon Associate I earn from qualifying purchases. Learn more
A useful error-group page should show how often an issue occurs, how many users it affects, when it appeared, which releases and environments are involved, why events are grouped, and what a representative event reveals. These six signals give administrators a practical way to prioritize and investigate problems. They are a design framework based on documented error-monitoring patterns—not a claim that a particular property-management agent product already provides these features.
What is the difference between an event and an event group?
An event is one occurrence of an error; a group collects occurrences for investigation. Google Cloud defines an individual error event as “a single occurrence of an error in your application.” A group is therefore a triage unit, not a single failure. Google Cloud Error Reporting documentation
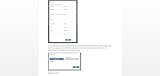
Grouping depends on identifying information such as stack traces, exception types, messages, or fingerprints. The exact algorithm varies by product. For example, GOV.UK’s Sentry guide describes a default order that uses stack trace first, then exception type, then message when earlier information is unavailable. GOV.UK Sentry documentation
The Tool Desk
Outbyte PC Repair FREEClear out junk files and repair common Windows errorsFree Scan →Outbyte Driver Updater FREEScan for outdated or missing drivers - takes under a minuteDriver Scan →Which six signals should an event-group page show?
1. Occurrence volume and recent frequency
Show the group’s occurrence count, and add a recent time-series or frequency view when the monitoring system supports one. The total indicates accumulated volume; a recent view helps distinguish a quiet historical issue from one that is recurring or spiking now. Google Cloud documents a group count, while New Relic documents recent occurrences and counts by version. Google Cloud Error Reporting documentation · New Relic error tracking documentation
#1 Best Overall

- Rental Property Management Software
- Easily Input and manage unlimited contacts including tenants and managers with status and details for followup Configure, save, filter, sort and group reports across standard and user-defined data fields.
- Store building and property information including insurance, notes, pictures and details Manage Lists of landlords, tenants, rooms, apartments down to the street level Easily manage landlords and Vendor details
- Includes accounting dashboard for invoices, payments and expenses
2. Affected users
Show distinct affected users separately from the event count. A high count may reflect repeated failures for one person, while fewer events may be spread across many people. The two measures answer different prioritization questions: how much error activity occurred, and how broadly it reached users. Google Cloud and New Relic both document affected-user metrics. Google Cloud Error Reporting documentation · New Relic error tracking documentation
3. First seen and last seen
Display when the group was first observed and when it most recently occurred. First seen helps establish the issue’s age; last seen shows whether it has recurred recently. Both Google Cloud and New Relic document group-level first- and last-seen times. Google Cloud Error Reporting documentation · New Relic error tracking documentation
Rank #2
4. Release and environment context
Associate occurrences with the release or version in which they happened, and provide version filtering or comparison where available. A version breakdown can help an administrator see whether recurrence coincides with a deployment; it does not establish that the release caused the error. New Relic documents occurrence counts by version. Environment labels should reflect the application’s own deployment model because there is no universal property-agent environment taxonomy in these sources. New Relic error tracking documentation
Free tools Windows power users keep installed
One-click scans. No signup required.
5. Group identity and explanation
Make the group’s error type and message visible, and expose its fingerprint or grouping explanation when the system provides one. This answers the practical question, “Why are these events grouped together?” Google Cloud says its grouping uses stack-trace information. Sentry’s documented default uses stack trace, then exception type, then message when earlier information is unavailable. These are examples, not a universal grouping rule; tools differ, and grouping rules can affect which occurrences an administrator sees together. Google Cloud Error Reporting documentation · GOV.UK Sentry documentation · New Relic error tracking documentation
Rank #3

- Easy-to-use for property owners who lease and/or for real estate investors
- A complete collection of landlord legal forms on CD
- Contents reviewed and approved by attorneys and industry experts
- 148 page e-book on CD with step by step instructions and state law appendix
- CD is compatible with Windows and Mac
6. A representative event with diagnostic context
Let administrators open a sample occurrence and inspect its stack trace and relevant event context. Google Cloud describes an event as carrying contextual information, and New Relic documents stack traces in error details. This view can support investigation, but the evidence does not make a representative event an automatic root-cause verdict. Google Cloud Error Reporting documentation · New Relic error tracking documentation
Independent reader supportYour contribution helps us test, update, and keep practical guides available for everyone.How should administrators use these signals together?
Start with recency and frequency to judge whether the group is active, then check affected users to understand its reach. Use release and environment context to narrow where or when the issue appears, and inspect the grouping explanation before treating all events in a group as equivalent. Finally, open a representative occurrence to gather diagnostic evidence. This sequence prioritizes investigation; it does not by itself prove cause or fix.
Rank #4
- Keep tracker of your rental homes and or apartments
When evaluating a specific monitoring tool or admin-page design, check whether it exposes grouping rules and customization, the time window behind counts, affected-user semantics, first- and last-seen definitions, release/version and environment filters, and the depth of event context. Confirm feature availability in that product’s current documentation before relying on it.
Quick Recap
Product prices and availability are accurate as of the date/time indicated and are subject to change. Any price and availability information displayed on Amazon at the time of purchase will apply.

