VplotR review
A focused, open-source R tool for researchers visualizing genomic feature positioning.
Reviewed by iTechGuides Editors · Editorial team · Updated Oct 2026
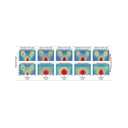
VplotR is an open-source R-based visualization tool for researchers analyzing genomic sequencing data, including genomic features and nucleosome positioning. Its purpose is focused: generate V-plots and show how genomic features are positioned. Researchers who already work in R and need this kind of publication-oriented output are its clearest audience; teams seeking a general-purpose dashboard or broad business-intelligence suite should look elsewhere.
The workflow is local rather than hosted. Users run analyses in their own R environment and supply sequencing-derived inputs, so the tool fits desktop use across Linux, macOS, and Windows without requiring a hosted dashboard. That makes it relevant to research groups that want to keep analysis in an R-based workflow. It also means users need to be comfortable with that environment; VplotR is not presented as a point-and-click visualization service or a broad data platform.
VplotR is available as open-source software with a free plan, which lowers the cost barrier for its specific use case. Its trade-off is scope: the plotting workflows center on V-plots from genomic data rather than a wider set of visualization needs. Documentation is the listed support channel, making the project a better fit for researchers comfortable consulting docs than for organizations that need other support channels. Choose it when genomic V-plots are the goal and local R analysis suits your team; choose a broader tool if you need hosted dashboards or visualizations beyond this specialized workflow.
VplotR pros and cons
- Where it wins
- Generates V-plots from genomic sequencing data
- Runs analyses locally in an R environment
- Open-source plotting workflows support publication-oriented outputs
- Where it doesn't
- Limited to specialized genomic visualization workflows
- Requires users to work in an R environment
- Not a hosted business-intelligence dashboard
VplotR fact sheet, pricing and score →
Advertiser disclosure: iTechGuides is reader-supported. Vendors can pay for top positions in our rankings and for a place on other products' pages, and we may earn a commission when you click some links. Bought places stand at the number bought; this page and our disclosure say so. Paying vendors may get a fuller, more detailed review from our editors, and that review can change their score. How we rank.
Last updated · How we research and update