
iTechGuides is reader-supported. When you buy through links on our site, we may earn an affiliate commission. As an Amazon Associate I earn from qualifying purchases. Learn more
A dashboard can show a reassuring p99 while users still hit slow requests because p99 values calculated separately on each server cannot be averaged into the service-wide p99. In Prometheus, combine histogram buckets across the intended servers first, then calculate the quantile. Also check which time window and labels your query combines: a healthy service-wide result can conceal a slow route, region, or customer segment.
Why averaging p99 values gives the wrong answer
A p99 is a rank within a particular set of requests: 99% of that set finished at or below the reported value. A p99 calculated on one instance describes that instance’s requests, not the combined population across all instances. Averaging several instance p99 values does not reconstruct the percentile of all requests; it discards the underlying request distribution.
Prometheus’s histograms and summaries documentation contrasts averaging summary quantiles with aggregating histogram buckets first. It states: “In this particular case, averaging the quantiles yields statistically nonsensical values.” The issue is not that the arithmetic was performed incorrectly; it is that an average of ranks is not the rank of the combined observations.
Do these 3 things before closing this tab:
1Repair Windows errors before they cause bigger problems2Fix the driver behind crashes, sound loss and screen glitches3Clear out junk files and repair common Windows errorsCalculate a service-wide p99 from classic histogram buckets
Classic Prometheus histograms expose cumulative bucket counters as series ending in _bucket. Each bucket has an le label for its inclusive upper bound. Calculate the rate for the chosen window, sum bucket rates across the instances you intend to combine while retaining le, and then pass the result to histogram_quantile().
#1 Best Overall
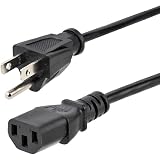
- HEAVY DUTY AC POWER CABLE: This 6ft (1.8m) 14AWG universal power cord with NEMA 5-15P and IEC 60320 C13 connectors is suitable for workstations/home office use | Rated to carry 125V at 15A
- PERFORMANCE AND SAFETY: UL listed (UL62 & UL817) | Fully molded strain relief connectors for durability | Fire Rating: VW-1 | 3 Conductor Power Cable made with 100% Copper Wire | This C13 thick gauge computer power cord is available in other lengths
- SPECS: 6ft (1.8m) AC Power Cord | NEMA 5-15P to IEC 60320 C13 | 14AWG | 125V 15A (Max) | Jacket Type: SJT | Jacket Material: PVC | Black | Temperature Range: 37°F to 140°F (3°C to 60°C) | Cable Outer Diameter: 0.3in (7.6mm)
- COMPATIBILITY: PC Power Cord NEMA 5-15P works with North American outlets | IEC C13 connector works with most desktop computers, servers, monitors, PDUs, printers, and more | Replacement PC power supply cable/cord
- THE IT PRO’S CHOICE: Designed and built for IT Professionals, this 3-prong power cable is backed for life, including free lifetime 24/5 multilingual technical assistance
histogram_quantile(0.99, sum by (le) (rate(http_request_duration_seconds_bucket[5m])))This example estimates the service-wide p99 over a five-minute rate window. If the result should remain separate by job, retain that label in the grouping:
histogram_quantile(0.99, sum by (job, le) (rate(http_request_duration_seconds_bucket[5m])))The expression sum by (le) combines every other label dimension present in those series. Add labels such as job or service when you need separate results, rather than allowing those populations to be merged.
Rank #2

- 【AMD Ryzen 3 5300U CPU: Outperforms N150 & 3500U】 BOSGAME E5 mini PC is powered by the TSMC 7nm FinFET architecture AMD Ryzen 3 5300U processor (4 Cores, 8 Threads, up to 3.8GHz boost, 6MB total cache). Compared to low-end Intel N150 or 3500U chips which only have 4 single threads and throttle under load, the 5300U delivers over 30% faster multi-core speed. Run 30+ browser tabs, large Excel sheets, and Zoom meetings simultaneously without system lag.
- 【8GB DDR4 RAM & 256GB NVMe SSD Storage】 Installed with high-speed 8GB DDR4 dual-channel memory and a fast 256GB M.2 2280 SSD, eliminating slow boot times and application loading delays. To accommodate growing data requirements, the upgradeable hardware design features dual SODIMM slots that allow you to expand memory up to 64GB RAM, ensuring smooth operation during heavy multitasking.
- 【High-Capacity Dual M.2 SSD Storage Expansion】 Never worry about running out of space for your business files. In addition to the pre-installed 256GB system drive, the motherboard houses an extra empty internal M.2 2280 NVMe PCIe 3.0 slot. This allows you to easily add a second solid-state drive for up to an additional 2TB of storage capacity (upgrades not included) without needing to remove or reinstall the original operating system.
- 【Radeon 6-Core Graphics & Triple 4K Displays】 Integrated with official AMD Radeon Graphics (6 Graphics Cores, 1500 MHz frequency) for casual gaming, photo editing, and crisp 4K media decoding. Featuring 1x HDMI 2.0 port, 1x DisplayPort, and 1x Full-Function Type-C port, the E5 outputs true 4K@60Hz resolution to three monitors at once. This multi-screen setup eliminates constant window-switching for traders, programmers, and office workers.
- 【Dual 2.5GbE LAN Ports for Advanced Networking】 Experience fast wired network transmission speeds up to 2500Mbps without lagging or buffering. The integration of dual 2.5 Gigabit Ethernet ports (powered by Realtek RTL8125 controller) makes this compact computer an exceptional hardware choice for tech enthusiasts. Easily configure it into software routers, hardware firewalls (pfSense, OpnSense), home NAS servers, or local homelabs.
Native histograms use a different aggregation expression
Native histograms are aggregated as histogram samples rather than as separate classic bucket series, so the query does not retain le. For a p99 kept separate by job, the pattern is:
histogram_quantile(0.99, sum by (job) (rate(http_request_duration_seconds[5m])))Prometheus documents both classic and native histogram forms in its query functions reference. Native histogram support and behavior can vary with the Prometheus release in use; check the documentation and query behavior for the deployed version.
Rank #3
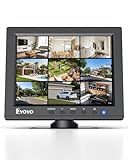
- EXTENDED USE: Designed for security monitoring and other long-running display tasks, this compact screen is suited for CCTV, DVR, NVR, server rooms, equipment checks, and other setups needing a dedicated display
- CONNECT YOUR GEAR: HDMI, VGA, BNC, and AV inputs support PCs, DVRs, NVRs, cameras, retro computers, and other video sources. USB Media Playback lets you play compatible videos, photos, and music without a PC
- CLEAR 4:3 VIEW: The native 1024x768 resolution and 4:3 aspect ratio match many surveillance systems, legacy computers, and industrial equipment, helping you view content without forcing a widescreen format
- SECURITY MONITORING: Use this small display as a dedicated screen for CCTV cameras, DVRs, and NVRs. Its compact size works well in control areas, equipment rooms, workbenches, and other space-limited monitoring stations
- IT & SERVER WORK: Keep a dedicated screen near your equipment for BIOS setup, server access, network troubleshooting, device testing, and maintenance without taking up the space of a full-size monitor
What the reported p99 can and cannot tell you
The time window defines which observations contribute
The [5m] range in rate() sets the calculation window. A short-lived slowdown can be diluted in a longer window, while a brief window may give a less stable view when requests are sparse. Choose a window that matches the incident or service question you are investigating.
The grouping labels define the population
A result grouped only by le can combine routes, regions, jobs, or other dimensions. That can make the aggregate look healthy even when users of one segment are seeing slow requests. Compare the aggregate with appropriately grouped queries for the route, region, or other population named in complaints.
Rank #4

- High-Resolution Touch Display – Features a 6.91 inch LCD with 1424x280 resolution, delivering sharp visuals and responsive touch control for efficient server management. NOTE: There will be a protective film on the screen surface. Please remove it before use.
- 10 inch 1U Rack-Mountable Design – Compact and space-saving, this monitor fits seamlessly into 10inch server racks, making it ideal for data centers and network cabinets.
- Compatible with DeskPi RackMate Series – Specifically designed for DeskPi RackMate T0/T1/T2/T0 Plus/T1 Plus/TL1/T1/2 Plus Server Cabinet and Standard 10 inch Server Rack, ensuring perfect integration and ease of installation.
- User-Friendly Touch Interface – The capacitive touchscreen allows for intuitive operation, reducing reliance on external input devices.
- Durable & Efficient for Server Use – This monitor offers reliable performance in server environments with low power consumption and robust construction.
A histogram quantile is an estimate
For classic histograms, Prometheus estimates a quantile that falls between bucket boundaries by interpolating within the bucket containing it. This calculation assumes observations are uniformly distributed inside that bucket, so the result is not the exact latency of a particular request. The estimate is less informative when the bucket spanning the p99 is wide or poorly placed for the latency range that matters. Prometheus describes the calculation and its assumptions in the histogram_quantile() documentation.
Quick wins for a faster PC:
Clear out junk files and repair common Windows errorsFree Scan →Scan for outdated or missing drivers - takes under a minuteDriver Scan →Repair Windows errors before they cause bigger problemsFix Now →There is also a boundary case to watch: if the selected classic-histogram quantile falls in the highest bucket, Prometheus returns the upper bound of the second-highest bucket. Check that configured buckets cover the tail you are trying to investigate.
Best Value

- Adjustable temperature control helps ensure optimal performance for rackmount such as network, server, music, and AV cabinets
- Noise controlled fans makes the cooling system useful for a quiet office or business space
- Compact design mounts to any 19" inch cabinet and takes up only 1 unit of space
- Simple and easy to use LCD display allows user to control temperature
- Air pumped through to the top exhaust system of the fan
Classic and native histograms at a glance
| Detail | Classic histogram | Native histogram |
|---|---|---|
| Aggregation for a quantile | Sum bucket rates and retain le before applying histogram_quantile(). |
Sum histogram rates directly; retain the labels for which separate results are needed. |
| Bucket representation | Separate cumulative bucket series with configured boundaries. | Composite histogram samples; standard schemas use exponential buckets. |
| Interpolation | Linear interpolation within the bucket containing the quantile. | Standard exponential buckets use exponential interpolation outside the zero bucket; the zero bucket and custom buckets use linear interpolation. |
| Version consideration | Check the deployed Prometheus version and configured bucket layout. | Check the deployed Prometheus version for the relevant support and query behavior. |
Prometheus explains histogram representations in its metric types documentation and provides additional detail on native histograms.
Trace a p99 mismatch step by step
- Inspect the metric type. Determine whether the query uses histogram data or per-instance summary series labeled with
quantile="0.99". Do not average those precomputed summary quantiles to obtain a service-wide p99. - Aggregate before calculating the quantile. For classic histograms, apply
rate()to the_bucketseries, sum across the intended instances while retainingle, and then callhistogram_quantile(). For native histograms, aggregate the histogram samples directly. - Check the classic buckets. Confirm
leremains in the classic query and that cumulative bucket counts are non-decreasing. Prometheus discusses bucket behavior in its histogram guidance. - Match the window and population to the complaint. Review the
rate()range and grouping labels. Run separate queries for the affected route, job, region, or other relevant dimension instead of relying only on a broad aggregate. - Inspect resolution around the tail. Find the bucket boundaries near the p99 and any latency threshold used by your service objective. A wide bucket can make interpolation too coarse to explain the observed slowdown.
- For native histograms, verify release behavior. Check the Prometheus version deployed and confirm it supports the native histogram query behavior you are relying on.
When a threshold is more useful than a percentile
If the operational question is “What fraction of requests met the latency target?”, examine the share of observations below that target as well as the p99. A percentile summarizes one position in the distribution; a threshold-based fraction directly answers how many observations were within a stated bound. Prometheus’s histogram guidance demonstrates threshold-based Apdex calculations.
Quick Recap
Product prices and availability are accurate as of the date/time indicated and are subject to change. Any price and availability information displayed on Amazon at the time of purchase will apply.
Free tools Windows power users keep installed
One-click scans. No signup required.

