
What’s actually slowing this PC down?
Pick the symptom - the matching free tool is one click away.
iTechGuides is reader-supported. When you buy through links on our site, we may earn an affiliate commission. As an Amazon Associate I earn from qualifying purchases. Learn more
To fix high memory usage on a Linux server, first check whether memory is genuinely under pressure, then identify the process, service, container, or kernel category responsible. A high “used” figure alone is not proof of a problem: start with MemAvailable, swap activity, pressure over time, and service impact. Change the setting or workload that matches the evidence rather than routinely clearing caches or raising limits.
How do I fix high memory usage on a Linux server?
Work through the diagnosis in this order. Preserve metrics and logs before restarting or terminating a service, since those actions can erase useful evidence.
- Confirm sustained pressure. Run
free -hmore than once or inspect monitoring history. Compare available memory and swap use with symptoms such as latency or OOM events. A single snapshot can miss a short-lived peak. - Identify what accounts for memory. Use
top,ps, orhtopto find candidate processes. If process totals do not explain host use, inspect shared memory, tmpfs, and kernel memory categories. - Check the service or container’s accounting. On cgroup v2 systems, inspect the relevant cgroup’s
memory.current,memory.stat,memory.events, and available swap counters. Include descendants in the service tree. - Check limits and event history. Determine whether
memory.highis causing reclaim and throttling or whether use is approachingmemory.max, which can lead to a cgroup OOM kill. - Correct the measured cause, then verify. Adjust application behavior, workload concurrency, a justified service limit, or host capacity as appropriate. Recheck available memory, swap and reclaim pressure, service latency, and OOM events after each change.
There is no universal safe memory percentage or one threshold that fits every server. Workload, reclaimability, swap configuration, and latency objectives all affect what counts as a problem.
Free tools Windows power users keep installed
One-click scans. No signup required.
Why is Linux using so much RAM?
Linux memory accounting includes more than application memory. File cache can be reclaimed when needed, while anonymous memory, shared memory, kernel slab, and other allocations have different purposes and reclaim behavior. The kernel defines MemAvailable as an estimate of memory available to start applications without swapping; it accounts for reclaimable memory and for the fact that not all slab can be reclaimed. See the Linux kernel /proc documentation.
#1 Best Overall

- HPE ProLiant DL380 Gen10 2U Rack Server with Rail kit for Enterprise
- Dual (2) Xeon Gold 6130 16-Core 2.10 GHz, 22MB, Up To 3.70 GHz Turbo
- Memory: 256GB (8 x 32GB) DDR4 PC4-25600 3200MHz Unbuffered Memory
- Storage: 7.68TB (4 x 1.92TB) Enterprise 2.5” SATA III 6Gb/s SSDs for Ultra Fast Storage
- Hard drives and memory upgrades included separately, not installed, installation required.
For a closer view, inspect /proc/meminfo. These fields help distinguish categories that a single “used” number combines:
MemAvailable: estimated memory available for new applications without swapping.Cached: cached file data.Shmem: shared memory, including memory-backed filesystems such as tmpfs.AnonPages: anonymous process memory, which is not backed by files.Slab,SReclaimable, andSUnreclaim: kernel slab allocations and their reclaimable and unreclaimable portions.DirtyandWriteback: pages awaiting or undergoing writeback.SwapTotalandSwapFree: total and free swap.
Compare these values over time. If host memory looks high but MemAvailable remains healthy and services are responsive, cache may explain much of the figure. If available memory is falling, swap use or reclaim activity is rising, or services are slowing, investigate the source rather than assuming the “used” figure is harmless. Kernel field definitions are available in the /proc reference.
Rank #2

- [CPU] AMD Ryzen 7 5700G Processor (8 Cores, 16 Threads, 3.8 GHz Base Clock Speed up to 4.6 GHz Max Boost Clock Speed) for Gaming and Content Creation with 7nm Leading Edge Technology | [STORAGE] 1TB PCIe NVMe M.2 SSD - Experience Hyper-Fast Bootup and Data Transfer thats up to 30x Faster Performance than a Traditional Hard Drive.
- Graphics: Integrated AMD Radeon Graphics | [RAM] 32GB DDR4 RAM 3200 Gaming Memory for Seamless Multitasking from Multiple Web Pages to Playing Games Online Simultaneously | [OS] Windows 11 Pro x64
- 2x 3.5" Drive Bays | 4x Expansion Slots | mATX Motherboard | ATX PSU
- [BUY WITH CONFIDENCE] Empowered PCs are Assembled in the USA, Rigorously Stress-Tested Before Shipping, and Supported with Lifetime Technical and Diagnostic Support and 3-Year Limited Hardware Warranty.
How do I find which process is using memory?
Start with a process view, but do not assume the largest process is the whole cause. Shared pages, service descendants, containers, tmpfs, and kernel allocations can make host totals differ from a list of individual process totals.
Crashes, No Sound, or Screen Glitches?
Random freezes, missing sound and display glitches usually trace back to one bad driver. Find and replace yours safely.Free scan · under a minutePC Slower Than It Used to Be?
A free scan shows the junk files, broken settings and background clutter dragging Windows down - then fixes them in one click.Free scan · Windows 10 & 11- List likely consumers. Use
toporhtopinteractively, orpsto inspect processes. Treat these as leads, then verify the relevant service or container accounting. - Locate the service’s cgroup. Identify the unit or container’s cgroup and inspect its memory accounting files. In cgroup v2,
memory.currentreports total use by that cgroup and its descendants, so compare the full service tree, not just the main process. - Read counters and events. Check
memory.statfor the accounting breakdown andmemory.eventsfor boundary events. Repeated high-boundary events can indicate reclaim and throttling; max-boundary events can indicate pressure at the hard limit. Interpret counters in context and compare them with service symptoms and metrics history. - Investigate unaccounted host use. If process and service totals do not explain the host, check
/proc/meminfofor slab, shared memory, and tmpfs-related use rather than killing an unrelated process.
The kernel documents cgroup v2 memory accounting and controls in its cgroup v2 guide. Available files and details depend on the system’s kernel, cgroup configuration, and distribution.
Rank #3

- HPE ProLiant DL360 Gen10 1U Rack Server with Rail kit for small business or Enterprise
- Dual (2) Xeon Gold 6130 16-Core 2.10 GHz, 22MB, Up To 3.70 GHz Turbo
- Memory: 256GB (8 x 32GB) DDR4 PC4-25600 3200MHz Unbuffered Memory
- Storage: 7.68TB (4 x 1.92TB) Enterprise 2.5” SATA III 6Gb/s SSDs for Ultra Fast Storage
- Hard drives and memory upgrades included separately, not installed, installation required.
What do memory.high and memory.max mean?
On cgroup v2, these controls have different effects. Check the service’s parent hierarchy and current event counters before changing either value.
| Control | What it does | Operational implication |
|---|---|---|
memory.high |
A throttle and reclaim boundary; it does not itself invoke the OOM killer. | Crossing it can cause heavy reclaim and slow the service even if the host still has available memory. |
memory.max |
A hard usage limit. If reclaim cannot bring usage down, the cgroup OOM killer may be invoked. | A service or container can be killed at its limit while the host still has memory available. |
These controls are documented in the kernel’s cgroup v2 memory controller reference. Do not raise a limit just because a service hit it: first determine whether the limit is appropriate for the workload and whether the host can absorb the additional demand.
Rank #4

- MT-VIKI 1568HL is all-in-one console to manage up to 8 computers. Features a 15.6" LCD monitor with 1920x1080@60Hz resolution. Combines monitor, keyboard, and touchpad into a single 1U rackmount drawer to save up to 85% of valuable cabinet space.
- Adjustable Depth & 2 set Rack Rails: Includes two sets of Rack Rails. Short Rack Rails: Fit 18.9"–23.6" (480-600mm) deep network racks (Note: check cable clearance for depths under 600mm). Long Rack Rails: Fit 23.6"–31.5" (600-800mm) deep standard racks. Measure your rack depth before purchase to ensure a perfect fit.
- External Monitor Support & Flexible Operation--Features an HDMI console output for connecting an external monitor, allowing convenient server access without opening the rack. Three Ways Switching: Support OSD menu, Hot-key or push button switching.This 8 port lcd kvm console provides 2-level password security (administrator and user), up to 8 authorized users and an administrator view and control the computers
- Lightweight Aluminum & Steel Build: Upgraded with an aluminum interior for less weight and a rugged steel drawer shell for industrial durability. Features a built-in handle and lock for secure operation. Physical Dimensions: 18.9" x 23.6" x 1.77" (480mm x 600mm x 45mm).
- Built for Professional Environments – Ideal for server rooms, data centers, industrial control systems, and security monitoring centers where multiple computers need centralized management or when technicians need direct access to connected systems without an external monitor.
What should I change once I find the cause?
Choose a correction based on the category and evidence. Prefer changes that are measured, reversible, and scoped to the actual source.
Recommended Free Tools
- One application’s memory grows continually: investigate its heap or cache settings, possible leak, and workload behavior. A restart may be a temporary mitigation only when operationally safe; capture useful metrics and logs first.
- A short workload peak hits a service limit: compare the limit with peak demand and actual capacity before raising it. A higher limit can shift pressure to the host and affect other services.
- Several services together create sustained pressure: reduce concurrent load or add capacity based on measured demand. Any hardware change must fit the server model and supported memory configuration.
- Shared memory or tmpfs is unexpectedly large: investigate which workload or subsystem owns it and whether its use is expected. Do not kill an unrelated process simply because it appears large.
- Kernel slab is the unexplained category: investigate the workload and kernel subsystem associated with the allocation. Distinguish reclaimable slab from unreclaimable slab before deciding what action is appropriate.
Swap can absorb some anonymous memory, but it does not fix a continuing leak or guarantee acceptable latency. Set swap policy and capacity for the workload and operational requirements; there is no universal size recommendation.
Best Value
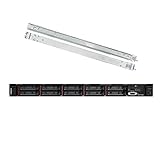
- Lenovo ThinkSystem SR630 is your reliable, easy to manage, and scalable 1U rack server, designed to excel at running a wide range of applications for small businesses up to large enterprises; rail kit is included for easy server installation
- Get professional-grade performance with Dual (2) Intel Xeon Silver 4110 8-Core 2.10GHz 11MB processors, with up to 3.2GHz turbo
- Speed, quality and reliability with 128GB DDR4 memory; Keep your data safe with software RAID
- Increase application performance, manage information more efficiently and store plenty of data with 8TB (4 x 2TB) 6Gb/s SATA III Solid State Drives
- Connectivity: VGA; 3 x USB 3.0; 1 x USB 2.0; Network: 4 x 1GbE ports standard; 1 x 1GbE dedicated management port; Hard drives and memory upgrades included separately NOT installed, installation required.
Is Linux cache memory safe to clear?
Do not routinely run echo 3 > /proc/sys/vm/drop_caches as a memory fix. The Linux man-pages describe this interface as a way to discard clean page cache, dentries, and inodes, primarily for testing or reproducible filesystem benchmarks. It does not free dirty objects, and losing caching benefits can degrade overall performance. See the drop_caches documentation.
Likewise, do not set vfs_cache_pressure=0 as a generic remedy. The kernel documentation says this stops reclaiming dentries and inodes under memory pressure and can contribute to OOM conditions. See the kernel VM sysctl documentation.
Can systemd manage out-of-memory pressure?
systemd-oomd is a userspace OOM manager that can monitor configured units and terminate a selected cgroup when configured memory-pressure or swap conditions are met. It uses cgroups v2 and pressure stall information (PSI), and can send SIGKILL to processes in the selected cgroup. It requires a full unified cgroup hierarchy and memory accounting enabled for monitored units. Confirm those prerequisites and the target units in your configuration before relying on it; behavior depends on systemd version and distribution setup. Details are in the systemd-oomd manual.
What evidence should I collect if the cause is still unclear?
Preserve enough information to compare host pressure with service behavior, especially before restarting a process or changing limits:
- Distribution and kernel version, plus whether the system uses cgroup v1 or cgroup v2.
- Repeated
free -houtput or monitoring history showing available memory and swap. - Relevant
/proc/meminfofields, includingMemAvailable, cache, shared memory, anonymous pages, slab, dirty/writeback, and swap values. - Process or service/container accounting and applicable cgroup
memory.current,memory.stat,memory.events, and swap counters. - OOM messages and timestamps, plus service latency or failure symptoms around the same period.
Use these observations to identify whether the issue is host-wide, limited to one service tree, or concentrated in a particular memory category. The kernel’s cgroup v1 pressure interface is deprecated; prefer current cgroup v2 accounting and pressure facilities where the system supports and configures them. See the kernel’s cgroup v1 memory documentation.
Quick Recap
Product prices and availability are accurate as of the date/time indicated and are subject to change. Any price and availability information displayed on Amazon at the time of purchase will apply.

