
Quick wins for a faster PC:
Scan for outdated or missing drivers - takes under a minuteDriver Scan →Repair Windows errors before they cause bigger problemsFix Now →Fix the driver behind crashes, sound loss and screen glitchesFind Drivers →iTechGuides is reader-supported. When you buy through links on our site, we may earn an affiliate commission. As an Amazon Associate I earn from qualifying purchases. Learn more
Build a pricing uptime dashboard by defining a successful customer-facing request, measuring internal errors and latency, and checking availability from outside the service. Keep those signals distinct: a page responding does not prove its prices loaded correctly, and an external probe does not explain why a request failed. A useful dashboard brings status, performance, regional checks, logs, deployment context, and telemetry usage together so operators can move from symptom to cause.
Define what “up” means before calculating availability
Choose the exact event that counts as success before displaying an uptime percentage. Depending on the service, that could mean the pricing page returns a response, its price data loads, or a complete user-visible transaction succeeds. These definitions measure different things; label the dashboard accordingly rather than presenting a simple response check as proof that the full experience works.

Document the check’s endpoint or transaction, its success criterion, and the reporting window in a panel note. Also decide how missing telemetry is handled. A missing data point is not automatically a successful request or an outage; show it as unknown or otherwise describe the chosen treatment. There is no universal uptime target established by the cited platform documentation, so set targets according to your service commitments and operational needs.
Which signals belong on the dashboard?
Internal request metrics
Collect request counts, error counts, and latency distributions for the pricing page or API path. Use consistent service and environment labels to filter and correlate panels. Keep dimensions focused on operational questions: adding unique values such as request IDs as metric labels can create high-cardinality series that are costly and difficult to use.
#1 Best Overall

- Automatic Router Rebooter / Reset - Stop manually restarting your router! Automate the process to ensure highly reliable internet connection uptime
- Constantly Monitors Router and/or Modem Internet Health. Keep Connect provides 24/7/365 protection to ensure that your smart home and connected devices are always online and available.
- Notifications - Free Texts or Emails from Keep Connect notifying you of detected eventsif you choose to enter your phone number/email. You may also choose No Notifications.
- Perfect for Smart Home Reliability - Schedule Periodic Resets to keep your connection fresh and fast.
- Premium Cloud Services App Available (iOS App Store and Google Play Store) - Our Premium Keep Connect Cloud Services platform allows using our Online/Mobile App to monitor many locations in one place as well. Cloud Services allows remote management of devices at all locations as well as heartbeat monitoring of your Keep Connects to notify you in the event of an ISP internet outage at one of your sites.
External availability checks
Run checks from regions that reflect where customers use the service. Show the latest result, recent failures, and the region that ran each check. External checks reveal whether the endpoint can be reached from outside your infrastructure, but they do not necessarily validate price correctness or a full customer journey. Use a synthetic transaction when the question is whether a sequence of user-visible steps succeeds.
Execution volume can scale with region count. Google Cloud states that an uptime check run in three regions counts as three executions. Its published pricing page lists $0.30 per 1,000 executions beyond 1 million executions per month per project; the page shows an effective date of October 1, 2022, so verify the live terms before budgeting. Google Cloud Monitoring pricing.
Google Cloud’s pricing page also lists synthetic monitors at $1.20 per 1,000 executions beyond an allowance of 100 executions per billing account. Confirm current terms before using that figure in an estimate. Google Cloud Monitoring pricing.
What’s actually slowing this PC down?
Pick the symptom - the matching free tool is one click away.
Logs and incident context
Use logs to investigate individual failures, not to define availability by themselves. Retain timestamps, service and environment, outcome context, and request or trace correlation identifiers needed to inspect an event. If your platform supports it, link an error or latency panel to a relevant log query. Add deployment annotations or incident markers so a change in the metrics can be compared with operational events.
Rank #3
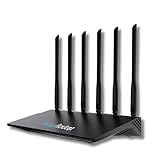
- 24/7 Internet Uptime with Self-Healing Technology – Proactively monitors your network, performs automatic reboots, and ensures uninterrupted connectivity without manual intervention.
- Smart Power Cycling for Speed Optimization – Seamlessly integrates with Keep Connect Rebooter Smart Plugs to trigger power cycles or reboots when speeds fall below user-defined thresholds.
- Free Local Monitoring & Alerts – Enjoy no-cost connection monitoring with email and SMS notifications, ensuring real-time updates on your network status without subscriptions.
- Advanced Cloud Features (Optional) – Upgrade to Keep Connect Cloud Services for remote management, analytics, and consolidated reporting across multiple devices, starting at just $24.99/year.
- Customizable OpenWrt Firmware – Built on OpenWrt for enhanced performance and flexibility, including regular speed tests, heartbeat checks, and both local and cloud-based reporting.
Arrange panels to move from status to diagnosis
- Top row: current service state. Show availability for the selected window, request and error rates, and latency percentiles. Display the definition of success and the reporting window near the availability value.
- Second row: outside-in checks. Show recent check results by region and any failed synthetic steps. Make clear whether a panel represents an endpoint probe or a broader transaction.
- Lower rows: investigation. Include useful error categories, links or queries for relevant logs, and deployment or incident annotations. Let operators follow a failure from the summary panel to the individual events that explain it.
- Usage panels: telemetry footprint. Track metric-series consumption separately from log ingestion, processing, writing, retention, or query usage, as applicable to the platform’s billing model.
Choose an implementation that fits your telemetry and query path
Compare options against your existing instrumentation and query language, supported external-check regions and transactions, retention and access controls, operational work to collect and query data, billing units, and the ease of tracing a panel into logs. The following examples document specific product behavior and charges; they are not a ranking of platforms.
Grafana Cloud usage and pricing
Grafana Cloud bills by product-specific usage units rather than treating all telemetry as one interchangeable quantity. Its usage documentation directs customers to the pricing page for current rates. Grafana Cloud usage documentation.
Rank #4

- Frequent WiFi or monitor disconnections are often caused by router network blockage, which can be fixed by rebooting the device. Rebooting timely frees router memory, optimizes bandwidth efficiency and prevents related network issues. Our timed power-off reboot cable automates this process, eliminating the need for manual intervention to schedule router reboots.
- SANHOOII rebooter cable can connect DC plug to your router adapter, it will power on and start timing automatically, you can press "H" to set the timming time 24/48/72 hour and press "M" to set the power outage duration 10sec/1min/3min. The usual suggestion is to power-off for 1 minute.
- LED Display: Shows current settings so you always know the schedule.
- Plug and play, one step in place, can greatly improve the efficiency of network bandwidth use. You can free your hands now!
- Rebooter cable suitfor CCTV Camera Monitor WiFi Ethernet Switch Network Webcam Moderm and etc.
On its 2026 pricing page, Grafana Labs lists a Pro platform fee of $19 per month alongside plan-specific included usage. It lists Pro log rates starting at $0.050 per GB to process, $0.400 per GB to write, and $0.100 per GB to retain. These are published units and rates, not a complete estimate of a deployment’s cost; check the current plan allowances and retention terms that apply to your account. Grafana Cloud pricing.
Grafana Labs also documents a separate Application Observability model for new customers at $0.025 per host hour, plus separate telemetry charges, effective February 13, 2026. Existing customers under the earlier model may have different terms, and serverless environments use telemetry-based billing. Do not apply the new-customer host-hour rate to every account. Application Observability documentation.
Best Value

- Connect up to eight PoE network devices through standard network cables carrying both data and electrical power, including wireless access points, VoIP phones, IP cameras and bridges. Any mix of PoE and non-PoE devices is supported.
- Allocate a 120-watt total PoE budget across eight output ports, with average distribution of 15 watts per port and up to 32 watts maximum per port. Power is delivered through IEEE 802.3at/af-compliant RJ45 ports for connected devices.
- Use eight auto-sensing 10/100/1000 Mbps RJ45 ports to connect computers, servers and network devices, while two RJ45 Gigabit uplink ports connect the switch to additional network infrastructure. Auto-MDIX supports automatic uplink detection.
- Maintain connected PoE device operation with the Powered Device Monitor feature, which restarts a PoE device that fails to respond or send network traffic. This self-healing network function helps restore communication for connected PoE devices.
- Configure manual VLAN mode to isolate ports 1 through 8 from one another, or use manual PoE extend mode to reduce network speed and extend PoE support to 820 feet. Select the operating mode to suit the installation and connected devices.
PromQL with CloudWatch metrics
AWS documents support for publishing OpenTelemetry metrics to CloudWatch and querying them with PromQL, which AWS describes as compatible with existing Grafana dashboards. This can be relevant when a team wants a PromQL-based query path for CloudWatch metrics; it does not establish that every dashboard or data source is interchangeable. Review the separate CloudWatch pricing and storage documentation for costs. CloudWatch PromQL documentation and CloudWatch documentation.
Independent reader supportYour contribution helps us test, update, and keep practical guides available for everyone.Keep telemetry cost and retention visible
Estimate the dashboard’s operating footprint using the units the selected platform actually bills. Metrics, logs, application observability, and external checks may be metered differently. Record both expected data volume and the retention period needed for incident investigation, and review those assumptions when the dashboard or service changes. Vendor rates and plan terms can change, so confirm the live pricing pages before making a budget commitment.
- For metrics, account for the platform’s applicable series, ingestion, or query units.
- For logs, distinguish processing or ingestion from writing, retention, and querying where the product bills them separately.
- For uptime checks and synthetic transactions, multiply executions by frequency and by the number of regions or steps that generate executions, as applicable.
- Display usage alongside operational value so telemetry that is expensive to retain but not useful for diagnosis can be reconsidered.
Build and validate the dashboard in a deliberate sequence
- Write down the success definition. Select the endpoint or transaction, response criterion, measurement window, and treatment of missing telemetry.
- Instrument the pricing path. Collect request volume, errors, and latency distributions, using consistent service and environment labels.
- Add outside-in checks. Select relevant regions and decide whether endpoint checks are sufficient or a synthetic transaction is needed. Estimate execution volume across regions.
- Preserve diagnostic context. Ensure logs carry timestamps, service/environment, outcomes, and correlation identifiers. Add links from metric panels to log queries where supported.
- Build from overview to detail. Place availability and performance first, regional checks next, and logs, error categories, deployment annotations, and usage below.
- Review cost and retention. Separate metric and log usage according to the platform’s billing model and keep only the retention needed for operational work.
- Validate expected behavior. Use a controlled test or replay of recorded data to confirm that panels respond as intended, including failures, missing data, and regional differences.
A dashboard is useful when it distinguishes what customers can reach from what the service reports internally, and when each summary signal has a clear path to the evidence needed to investigate it.
PC Slower Than It Used to Be?
A free scan shows the junk files, broken settings and background clutter dragging Windows down - then fixes them in one click.Free scan · Windows 10 & 11Outdated Drivers Are Slowing You Down
One free scan finds every outdated or missing driver and matches the right update for your exact hardware.Free scan · exact hardware matchQuick Recap
Product prices and availability are accurate as of the date/time indicated and are subject to change. Any price and availability information displayed on Amazon at the time of purchase will apply.

