
iTechGuides is reader-supported. When you buy through links on our site, we may earn an affiliate commission. As an Amazon Associate I earn from qualifying purchases. Learn more
Estimate a scientific GPU from the workload, not from a card’s largest headline number. Define the largest realistic data set, numerical precision, algorithm phases and parallelism; add every allocation that is live at the same time; then compare arithmetic intensity and data movement with the candidate GPU’s usable memory, bandwidth and precision-specific throughput. Treat the arithmetic as a first estimate and validate it with a representative run, because theoretical peaks are ceilings rather than predictions.
What you are actually estimating
GPU sizing has two separate questions:
- Capacity: Can device memory hold the data and all temporary state required by the busiest phase?
- Speed: Can the GPU move that data and perform the required operations quickly enough?
A large input file is not a memory requirement by itself. A solver may need several copies of the state, output buffers, sparse or dense matrices, halo regions, library workspaces and cached values at once. Conversely, a data set that fits in memory can still run slowly if each kernel repeatedly fetches it from memory or if the GPU waits for the host.
There is no published, universal amount of memory or compute that all “scientific workloads” require. The answer depends on dimensions, algorithm, implementation, precision, retained outputs, parallelism and software support. The practical method below produces a defensible estimate for your case.
What’s actually slowing this PC down?
Pick the symptom - the matching free tool is one click away.
How much GPU memory do I need?
Size for peak live device memory: the sum of allocations that coexist at the point of maximum use. Include runtime and library allocations, not only the arrays you created explicitly.
#1 Best Overall

- Graphics Card Interface: Pci E
Build an allocation inventory
| Allocation | What to record | First-order calculation |
|---|---|---|
| Inputs and state | Grid or mesh dimensions, batch or ensemble count, state vectors and fields | Element count × bytes per element |
| Outputs | Results retained concurrently, checkpoints and diagnostics | Element count × bytes per element |
| Intermediates | Temporary arrays, transformed data, residuals and halo/exchange buffers | Element count × bytes per element |
| Structural data | Sparse indices and values, dense matrices, graph or mesh metadata | Count each value and index type separately |
| Solver and library workspaces | Factorization, FFT, BLAS, communication and framework scratch space | Use the workspace size reported by the implementation when available |
| Cached or replicated state | Read-only tables, model constants and copies on each GPU | Count one copy per device where replication occurs |
Sum only allocations whose lifetimes overlap. If a temporary is freed before the next phase allocates its buffer, it does not contribute to the same peak; if an allocator retains the block, the runtime may still report it as reserved. Record both allocated and reserved memory when your framework exposes both.
Convert units and leave explicit headroom
Use bytes internally, then label the result clearly. Decimal gigabytes use 1 GB = 109 bytes; binary gibibytes use 1 GiB = 230 bytes. Vendor specifications often use GB while tools and operating systems may display GiB, so the numbers will not match exactly. NVIDIA’s CUDA Best Practices Guide illustrates the distinction: a historical V100 calculation gives 898 GB/s using decimal units, or 836.4 GiB/s with a 10243 divisor (NVIDIA CUDA C++ Best Practices Guide).
Do not apply a universal “overhead percentage.” The required margin depends on the allocator, framework, driver, communication buffers and how much the problem may grow. Instead, state your measured peak, the free capacity left on the candidate device and the growth you need to accommodate. A card that barely fits today can fail when an output is retained for debugging or a library chooses a larger workspace.
Recommended Free Tools
Profile the largest realistic case
Run the actual code with representative dimensions, mesh or grid shape, batch or ensemble size, solver settings and precision. A tiny synthetic input can hide a phase that dominates at production scale or keep a workspace below a threshold. NVIDIA emphasizes that profiling is useful only when the workload is realistic: “The most important consideration with any profiling activity is to ensure that the workload is realistic – i.e., that information gained from the test and decisions based upon that information are relevant to real data.” See the CUDA C++ Best Practices Guide.
Capture the maximum device allocation during the run, including initialization and teardown phases if they overlap with useful work. Repeat for the largest case you expect to deploy; document whether multiple GPUs hold replicated or partitioned data.
A practical estimation workflow
1. Define a representative workload
- Write down every dimension: grid or mesh extents, number of variables, time steps, batch or ensemble size and number of right-hand sides.
- Identify the largest production case, not just the average case used for development.
- List phases such as assembly, preprocessing, solve, time stepping, transforms and post-processing.
- Mark which inputs, outputs and workspaces overlap in each phase.
- Record the numerical format actually used by the algorithm and libraries: for example, single, double, mixed or another supported precision.
This inventory gives you a workload specification against which every GPU can be compared. It also exposes opportunities to stream data or free an intermediate before the peak phase.
Rank #2

- Professional AI & Creator Workstation: AMD Radeon AI PRO R9700 GPU with 32GB GDDR6 is engineered for AI development, professional content creation, and compute-intensive workloads.
- Massive 32GB Memory Capacity: 32GB of GDDR6 memory on a 256-bit bus provides ample bandwidth for large AI models, 8K video editing, and complex 3D rendering.
- Advanced RDNA 4 with AI Accelerators: 64 Compute Units with 3rd Gen Ray Tracing and dedicated 2nd Gen AI Accelerators for groundbreaking AI performance and visual computing.
- Professional Blower Cooling: Efficient single blower design exhausts heat directly out of the chassis, ideal for multi-GPU workstation and server configurations.
- Enterprise-Grade Thermal Solution: Vapor chamber heatsink with industrial Honeywell PTM7950 thermal interface material ensures reliable cooling under sustained professional loads.
2. Calculate peak live memory
- For each allocation, multiply element count by the bytes in its data type. Add index and metadata storage for sparse structures.
- Group allocations by phase and sum only those that coexist.
- Add workspace and scratch requirements reported by the solver, framework and vendor libraries.
- Account for per-device copies and communication buffers in a multi-GPU run.
- Compare the estimate with usable device memory, not the printed capacity alone, then verify the peak with a representative execution.
The calculation is a planning aid, not a guarantee. Fragmentation, allocator caching, alignment and implementation changes can move the observed peak, which is why the run-time measurement is decisive.
Free tools Windows power users keep installed
One-click scans. No signup required.
3. Count operations and bytes for important kernels
For each time-consuming kernel, estimate floating-point operations (FLOPs) and bytes read from or written to device memory. Define arithmetic intensity as:
arithmetic intensity = operations performed / bytes moved
Use the bytes the implementation actually moves when possible. A nominal “one read and one write” model can be optimistic if a kernel rereads values, spills registers or performs extra conversions.
4. Make a first-order roofline-style check
NVIDIA describes the two limiting times as approximately:
The Tool Desk
Outbyte Driver Updater FREEScan for outdated or missing drivers - takes under a minuteDriver Scan →Outbyte PC Repair FREERepair Windows errors before they cause bigger problemsFix Now →memory time = bytes moved / memory bandwidthmath time = operations / math throughput
Compare your kernel’s arithmetic intensity with the GPU’s compute-to-memory-bandwidth ratio for the same precision. Low intensity generally points toward a bandwidth limit; high intensity can be compute limited if enough independent work exists to occupy the device. AMD presents the same arithmetic-intensity concept as FLOPs per byte in its GPU performance documentation.
Rank #3

- NVIDIA Volta GV100 Architecture — 4,608 CUDA Cores, 640 1st-Gen Tensor Cores delivering 14 TFLOPS FP32 and 112 TFLOPS deep learning performance for AI training, inference, HPC, and scientific computing workloads
- 32GB HBM2 ECC Memory — 900 GB/s Bandwidth — High-bandwidth memory on a 4096-bit bus with ECC error correction provides the memory capacity and throughput required for the largest AI models, simulations, and datasets
- PCIe 3.0 x16 Interface — 250W TDP — Standard PCIe Gen3 connectivity with passive cooling designed for enterprise rack server deployment in HPE ProLiant, Dell PowerEdge, and Supermicro platforms with adequate chassis airflow
- NVLink — Scale to 96GB Unified Memory — Connect two V100 GPUs via NVLink at 300 GB/s bi-directional bandwidth to scale GPU memory from 32GB to 96GB for larger AI training and HPC workloads
- Multi-Precision Computing — Supports FP64 (7 TFLOPS), FP32 (14 TFLOPS), FP16 (112 TFLOPS) and INT8 precision modes for flexible deployment across training, inference, and scientific simulation workloads
This is a bound, not a performance promise. Irregular accesses, synchronization, instruction overhead, cache behavior, limited occupancy and serial sections can keep achieved throughput well below either theoretical ceiling.
5. Profile and replace assumptions with measurements
- Find the functions consuming the most elapsed time.
- Measure achieved memory bandwidth and compare it with the specification.
- Measure achieved arithmetic throughput in the precision the kernel uses.
- Check occupancy or other evidence that enough parallel work is available.
- Measure host-to-device and device-to-host transfers, synchronization and inter-GPU communication.
- Compare the memory peak observed during the same run with your allocation inventory.
NVIDIA recommends effective-bandwidth measurements for realistic workloads; AMD’s documentation discusses achieved FLOPs, memory transactions and operational intensity. If achieved values are far below the theoretical limits, investigate access patterns, transfers and parallelism before buying a larger accelerator. More capacity does not repair an algorithm that is waiting on a PCIe transfer or launching too little work.
Is my workload memory bound or compute bound?
Signs of a memory-bound kernel
- Arithmetic intensity is low relative to the candidate GPU’s compute-to-bandwidth ratio.
- The kernel moves a large volume of data but performs comparatively few operations.
- Measured bandwidth is high while achieved math throughput remains modest.
- Changing to a GPU with substantially more compute but similar bandwidth produces little improvement.
For these workloads, prioritize usable bandwidth, coalesced and cache-friendly access, data locality and reducing unnecessary reads and writes. A larger memory capacity helps only when the current device cannot hold the working set; it does not automatically make each byte move faster.
Signs of a compute-bound kernel
- Arithmetic intensity is high relative to the hardware ratio.
- Achieved operations approach the device’s precision-specific throughput while bandwidth is not saturated.
- The kernel exposes enough independent work to fill the GPU.
Choose throughput for the precision your method permits and your libraries implement. A quoted peak in a different precision is not a valid substitute. Double-precision throughput may be the deciding specification for a scientific solver even when a device advertises a much larger half- or single-precision number.
When neither simple label fits
Many applications alternate between limits: assembly may be bandwidth bound, a factorization compute bound, and a reduction limited by synchronization. Host-device transfers can dominate the entire job even when individual kernels look efficient. Profile by phase and optimize the critical path rather than assigning one label to the application as a whole.
What GPU specifications matter for scientific computing?
Evaluate candidates in the order imposed by your measured workload.
Rank #4
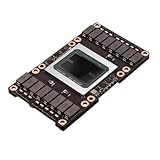
- Robust Design:Constructed to withstand high temperatures, the V100 16GB SXM2 card operates efficiently up to 105℃.
- Advanced Connectivity:Features a SXM2 connector for seamless integration with a wide range of systems, ensuring compatibility.
| Comparison axis | Question to answer | Why it matters |
|---|---|---|
| Usable memory | Does capacity exceed measured peak with the growth margin you require? | A fast GPU that cannot hold the live working set will spill, stream or fail. |
| Memory bandwidth | How does sustained bandwidth compare with measured data traffic? | It is central when arithmetic intensity is low, but specification bandwidth is a ceiling. |
| Required-precision throughput | What is the supported throughput for the precision and operations your method uses? | Peak figures in another precision can be irrelevant or misleading. |
| Software compatibility | Do your compiler, framework, solver and numerical libraries support the GPU and required features? | Unsupported kernels or missing precision paths can erase theoretical advantages. |
| Parallelism | Can your workload expose enough independent work to occupy the device? | Small, serial or synchronization-heavy phases under-use a large accelerator. |
| Data movement | What are host-device, peer-to-peer and inter-GPU transfer costs in the deployment topology? | Transfers and communication can dominate elapsed time and limit scaling. |
Google Cloud’s overview likewise lists computation, memory, precision and scalability as GPU-selection factors (Understand GPUs). Treat software support and topology as go/no-go checks, not optional extras.
Do these 3 things before closing this tab:
1Scan for outdated or missing drivers - takes under a minute2Repair Windows errors before they cause bigger problems3Fix the driver behind crashes, sound loss and screen glitchesHow to compare two candidate GPUs without being misled
- Filter by capacity: reject any device whose usable memory is below the measured peak plus your stated headroom.
- Match precision: compare throughput for the format actually used by the solver or kernel.
- Check the likely bottleneck: use bandwidth for memory-bound phases and precision-specific compute for compute-bound phases.
- Confirm support: verify drivers, compiler targets, framework versions and numerical-library features for the deployment environment.
- Measure scaling: for multi-GPU execution, test partitioning, peer transfers, collective operations and synchronization; do not assume that doubling cards doubles speed.
- Validate with the same workload: benchmark representative dimensions and report achieved bandwidth, achieved operations, memory peak and transfer time.
Do not rank cards by one peak specification. A device with more memory may be the only feasible choice for a capacity-constrained solve, while a smaller device with better bandwidth or required-precision throughput may finish a bandwidth- or compute-bound kernel sooner once the working set fits.
Model-specific figures: useful examples, not sizing rules
Vendor documentation contains concrete figures that illustrate how specifications are reported. They are not estimates of a generic scientific workload.
| Example | Published figure | How to interpret it |
|---|---|---|
| NVIDIA A100 example in the GPU Performance Background guide | 80 GB HBM2; up to 2039 GB/s bandwidth | Model-specific capacity and peak bandwidth, not a recommendation for every scientific application (NVIDIA GPU Performance Background User’s Guide). |
| NVIDIA V100 calculation in the CUDA Best Practices Guide | 898 GB/s theoretical peak bandwidth, based on a 877 MHz HBM2 memory clock and 4096-bit interface | Historical, model-specific arithmetic; the same guide gives 836.4 GiB/s when using a 10243 divisor (CUDA C++ Best Practices Guide). |
Neither figure establishes how much memory or compute a scientific workload “needs.” Use your measured peak, traffic and required precision instead.
Multi-GPU and data-placement considerations
Multiple GPUs increase aggregate resources only when the algorithm can partition its work and data efficiently. If each device receives a full copy of a large state, capacity may not add linearly; replication can make per-device memory the limiting factor. If the state is partitioned, account for halo exchanges, reductions, broadcasts and synchronization at every iteration.
Measure the topology you will deploy: host-to-device links, peer-to-peer paths and inter-GPU fabric differ. A kernel that scales on one node can lose its benefit when communication crosses a slower link. Keep frequently exchanged data resident where possible, overlap communication with computation when the implementation supports it, and include transfer time in the end-to-end measurement.
Common estimation mistakes and fixes
- Using input-file size as GPU memory: inventory live inputs, outputs, intermediates, workspaces and replicated state.
- Adding every allocation regardless of lifetime: draw a phase timeline and sum only overlapping allocations.
- Confusing GB and GiB: label units and use the same divisor when comparing specification and profiler output.
- Applying an arbitrary overhead percentage: measure allocator, runtime and library use, then state a workload-specific margin.
- Choosing the largest peak FLOP number: match precision and determine whether the kernel is bandwidth or compute limited.
- Trusting theoretical bandwidth: measure effective bandwidth on realistic data; access patterns and under-utilization reduce achieved values.
- Benchmarking toy inputs: run the largest representative dimensions and the phases whose allocations overlap at production scale.
- Ignoring transfers: profile host-device copies, synchronization and inter-GPU traffic as part of elapsed time.
- Assuming a single bottleneck: profile each major phase; one application can alternate between memory, compute and communication limits.
- Buying before checking software: confirm framework, compiler, driver and numerical-library support for the target GPU and precision.
A compact worksheet for your next estimate
- Write the largest realistic dimensions, batch or ensemble count and retained outputs.
- Record bytes per element and count values, indices, metadata and per-device copies.
- Map allocation lifetimes and calculate the largest simultaneous total.
- Run the representative case and record peak allocated and reserved device memory.
- For dominant kernels, estimate operations and bytes moved, then calculate arithmetic intensity.
- Compare that intensity with the candidate’s compute-to-bandwidth ratio in the required precision.
- Measure achieved bandwidth, achieved operations, occupancy or available parallelism, and transfer time.
- Select the least costly candidate that clears capacity, software, precision, bottleneck and scalability checks with the headroom your project requires.
This process turns a vague question—“How much GPU do I need?”—into measurable limits: a peak live-memory number, a data-movement requirement, a precision-specific compute requirement and a validated deployment topology.
Quick Recap
Product prices and availability are accurate as of the date/time indicated and are subject to change. Any price and availability information displayed on Amazon at the time of purchase will apply.

