
Free tools Windows power users keep installed
One-click scans. No signup required.
iTechGuides is reader-supported. When you buy through links on our site, we may earn an affiliate commission. As an Amazon Associate I earn from qualifying purchases. Learn more
To verify that an app is using a laptop GPU, watch the app while it is actively rendering, playing, encoding, decoding or computing. On Windows, open Task Manager and inspect that process’s GPU and GPU engine columns. On a dual-GPU MacBook Pro, open Activity Monitor, choose Energy, and read the Graphics Card column. On supported NVIDIA systems, run nvidia-smi or nvidia-smi pmon to list active processes.
A low 3D percentage does not prove that the GPU is idle. An app may be using a compute, video-encode or video-decode engine instead. You must identify the process and the engine handling its current workload, not rely on a laptop having a discrete chip or on a single overall percentage.
What “using the GPU” actually means
A graphics chip contains several engines. The familiar 3D engine handles rendering, but applications can also schedule compute, video encode or video decode work. Windows Task Manager can expose work submitted through DirectX, OpenGL, OpenCL, Vulkan and proprietary APIs. Consequently, an application can be doing substantial GPU work while its 3D graph remains quiet.
GPU selection is also dynamic. A browser, editor, game or media application may use the integrated adapter for one task and the discrete adapter for another, or switch engines as the workload changes. Perform the check while reproducing the exact problem: play the video, start the render, open the game scene or run the calculation that you want to diagnose.
#1 Best Overall

- Beyond Performance: The Intel Core i5-13420H processor goes beyond performance to let your PC do even more at once. With a first-of-its-kind design, you get the performance you need to play, record and stream games with high FPS and effortlessly switch to heavy multitasking workloads like video, music and photo editing.
- AI-Powered Graphics: The state-of-the-art GeForce RTX 4050 graphics (194 AI TOPS) provide stunning visuals and exceptional performance. DLSS 3.5 enhances ray tracing quality using AI, elevating your gaming experience with increased beauty, immersion, and realism.
- Visual Excellence: See your digital conquests unfold in vibrant Full HD on a 15.6" screen, perfectly timed at a quick 165Hz refresh rate and a wide 16:9 aspect ratio providing 82.64% screen-to-body ratio. Now you can land those reflexive shots with pinpoint accuracy and minimal ghosting. It's like having a portal to the gaming universe right on your lap.
- Internal Specifications: 8GB DDR5 Memory (2 DDR5 Slots Total, Maximum 32GB); 512GB PCIe Gen 4 SSD
- Stay Connected: Your gaming sanctuary is wherever you are. On the couch? Settle in with fast and stable Wi-Fi 6. Gaming cafe? Get an edge online with Killer Ethernet E2600 Gigabit Ethernet. No matter your location, Nitro V 15 ensures you're always in the driver's seat. With the powerful Thunderbolt 4 port, you have the trifecta of power charging and data transfer with bidirectional movement and video display in one interface.
Keep three separate questions in mind:
- Is the device busy? An aggregate graph answers this, but not which process caused it.
- Which process is responsible? You need a per-process listing or column.
- What kind of work is running? The engine name distinguishes 3D, compute, encoding, decoding and other activity.
Check an app on Windows with Task Manager
Task Manager is the most broadly useful Windows starting point because it can associate a process with a GPU and an engine. Labels and layout vary slightly between Windows releases, but the information to look for is the same.
1. Start the workload before measuring
- Launch the application you want to test.
- Begin the operation that should use graphics hardware, such as playing a high-resolution video, moving through a 3D scene, exporting a project or running a compute job.
- Leave that operation running so you can observe it instead of checking after it has finished.
2. Open the process view
Open Task Manager (for example, with Ctrl+Shift+Esc) and select the process list. Find the application itself and, when necessary, expand it to see child processes. Browsers, launchers and media tools often split their GPU work among several processes, so the visible window may not be the process doing the rendering.
3. Read the GPU and GPU engine columns
In the process list, inspect the GPU and GPU engine values for the relevant process. If those columns are not visible, use the column-selection menu on the header row and enable them. The GPU value is a utilization reading for that process; the GPU engine value identifies the adapter and engine, such as a device index followed by 3D, Compute, Video Decode or Video Encode.
A nonzero reading that appears while the workload is active is evidence that the process is scheduling work on a GPU. The engine label tells you what kind of work it is. For example, a video player may show Video Decode rather than a high 3D value, while a machine-learning or scientific task may show Compute.
4. Map the GPU index to the physical adapter
Task Manager can show more than one GPU, commonly an integrated adapter and a discrete adapter. Before deciding that “GPU 1” is the faster chip, open the GPU performance views and check which index corresponds to each device. Adapter numbering is not a guarantee that the discrete device is number 1, and the order can differ between laptops.
Once the mapping is known, read the process’s engine entry together with the index. “GPU 0 – 3D” and “GPU 1 – 3D” represent different adapters even though both are doing 3D work. If the application moves between adapters, watch the entry during the transition rather than recording only one moment.
Rank #2
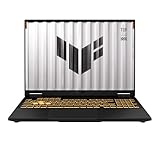
- READY FOR ANYTHING – Dive headfirst into gaming on Windows 11 powered by the Intel Core i5 Processor 13450HX and an NVIDIA GeForce RTX 5050 Laptop GPU with a Max TGP of 115W and NVIDIA Advanced Optimus.
- SUBTLE STYLING – The TUF Gaming F16 maintains its classic design, boasting a subtle embossed TUF logo on its sleek cover.
- IMMERSIVE VISUALS – The TUF Gaming F16’s FHD+ 165Hz display with 100% sRGB color draws you into the action. Adaptive-Sync technology reduces lag, minimizes stuttering, and eliminates visual tearing for ultra-smooth gameplay.
- MILITARY GRADE DURABILITY – As a TUF gaming machine, the F16 has been rigorously tested to meet Military Grade testing standards, MIL-STD-810H. Rest easy knowing this laptop will operate at peak performance in harsh conditions.
- EFFICIENT COOLING – Equipped with 2nd Gen Arc Flow Fans, full-width heatsink, and full-width vent, the TUF Gaming F16 optimizes cooling performance without extra noise.
5. Observe more than one instant
Task Manager’s representative overall GPU percentage is based on the busiest engine. It is therefore a useful indication of whether some engine is busy, but it is not a complete sum of all engines and does not identify the responsible process by itself. Keep the process row visible while you repeat the workload and look for a matching change in its GPU and GPU engine fields.
Quick wins for a faster PC:
Fix the driver behind crashes, sound loss and screen glitchesFind Drivers →Repair Windows errors before they cause bigger problemsFix Now →Scan for outdated or missing drivers - takes under a minuteDriver Scan →How to interpret Windows engine readings
3D
The 3D engine is the expected entry for game rendering, 3D modeling viewports and many visual effects. A low value can mean the scene is simple, the application is waiting on the CPU or the app is using another engine; it does not by itself establish that no GPU work is occurring.
Compute
Compute engines handle general-purpose GPU jobs. These can come from DirectX, OpenCL, Vulkan or a vendor-specific API. A compute-heavy task may show little 3D activity while still using the graphics chip intensively.
Video Decode and Video Encode
Playback and export can use fixed-function video engines. Hardware decoding may appear when a video is playing, while encoding can appear during recording or export. In these cases, a quiet 3D graph is normal; the video engine entry is the relevant evidence.
Several engines at once
An application can schedule different jobs simultaneously, and separate child processes can appear in Task Manager. Check each related process and note the engine shown at the time of the workload. Do not collapse all activity into the 3D number.
What’s actually slowing this PC down?
Pick the symptom - the matching free tool is one click away.
Windows troubleshooting when the result looks wrong
The app shows no obvious 3D activity
Read the GPU engine field first. Look for Compute, Video Decode or Video Encode entries. If no engine is active, repeat the workload and verify that you selected the process that owns the work rather than a launcher or an idle parent process.
Rank #3
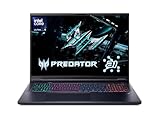
- Desktop-Level Performance, Anywhere: Get legendary gaming performance with the Intel Core Ultra 9 275HX processor, delivering ultra-smooth gameplay and future-ready AI (Up to 13 NPU TOPS). Offload tasks like background removal and audio optimization to the NPU for seamless streaming and gaming, while Intel Application Optimization enhances performance on classic titles.
- Game-Changing Realism: Powered by NVIDIA Blackwell architecture, GeForce RTX 5070 Ti Laptop GPU unlocks the game changing realism of full ray tracing. Equipped with a massive level of 992 AI TOPS horsepower, the RTX 50 Series enables new experiences and next-level graphics fidelity. Experience cinematic quality visuals at unprecedented speed with fourth-gen RT Cores and breakthrough neural rendering technologies accelerated with fifth-gen Tensor Cores.
- Supreme Speed. Superior Visuals. Powered by AI: DLSS is a revolutionary suite of neural rendering technologies that uses AI to boost FPS, reduce latency, and improve image quality. DLSS 4 brings a new Multi Frame Generation and enhanced Ray Reconstruction and Super Resolution, powered by GeForce RTX 50 Series GPUs and fifth-generation Tensor Cores.
- The Ultimate in Ray Tracing and AI: NVIDIA RTX is the most advanced platform for full ray tracing and neural rendering technologies that are revolutionizing the ways we play and create. Over 700 games and applications use RTX to deliver realistic graphics and incredibly fast performance with cutting-edge AI features like DLSS Multi Frame Generation.
- Immersive Depth and Detail: At 18 inches with a 16:10 aspect ratio, the pristine WQXGA screen offering vibrant colors with up to 100% DCI-P3 operates at a fast 240Hz refresh and 3ms overdrive response time. Alongside the suite of features from NVIDIA G-SYNC and NVIDIA Advanced Optimus, you're guaranteed that whatever's on-screen is a distinct viewing delight.
The laptop has a discrete GPU, but the app appears on the integrated one
Hardware presence does not prove that an application is using the discrete adapter. Confirm the adapter index mapping in Task Manager, then watch the process while the demanding operation runs. Some applications intentionally use the integrated adapter for light work or switch devices only for particular stages.
The overall GPU graph is busy, but your app is not
An overall device graph cannot attribute activity to an individual program. Use the process-level GPU and GPU engine fields and inspect other visible processes. Background video playback, a browser tab or another application may be generating the activity.
The GPU value is low or briefly reaches zero
Utilization is instantaneous and workload-dependent. A process can allocate resources, submit short bursts or wait for the CPU, so a momentary zero does not disprove GPU use. Measure during a sustained operation and compare the reading with the app’s visible behavior.
Check a dual-GPU MacBook Pro with Activity Monitor
Apple documents a per-app indicator for MacBook Pro models that have both integrated and discrete graphics processors. The terminology and columns described here do not apply universally to every Mac; many Apple silicon models do not present the same integrated-versus-discrete arrangement.
Use the Energy tab for per-app attribution
- Open Activity Monitor.
- Select the Energy tab.
- Locate the application in the process list and read the Graphics Card column.
That column indicates whether the app is using the higher-performance discrete GPU. It is the cited Mac indicator for identifying the application, rather than merely showing that some GPU activity exists.
Use GPU History for aggregate activity
To see how hard the Mac’s GPU has been working over time, choose Window > GPU History in Activity Monitor. The history graph shows aggregate GPU activity. It does not, by itself, name the process responsible, so use the Energy tab’s Graphics Card column when attribution matters.
Rank #4

- Advanced Hybrid Architecture Performance: The Intel Core 7 processor 240H enables you to play games, stream, and create simultaneously with ease. Intel Application Optimization boosts performance further by intelligently allocating application resources in real time
- NVIDIA Blackwell Architecture Graphics: Powered by GeForce RTX 5050 Laptop GPU, unlocking game-changing realism of full ray tracing. Equipped with a massive level of 440 AI TOPS horsepower, the RTX 50 Series enables new experiences and next-level graphics fidelity. Experience cinematic quality visuals at unprecedented speed with fourth-gen RT Cores and breakthrough neural rendering technologies accelerated with fifth-gen Tensor Cores
- AI-Powered DLSS Technology: DLSS is a revolutionary suite of neural rendering technologies that uses AI to boost FPS, reduce latency, and improve image quality. DLSS 4 brings a new Multi Frame Generation and enhanced Ray Reconstruction and Super Resolution, powered by GeForce RTX 50 Series GPUs and fifth-generation Tensor Cores
- High-Resolution Display with Fast Refresh Rate: Experience exceptional clarity and vibrant detail with the 16 inch WUXGA 1920 x 1200 display, featuring true-to-life, accurate colors. Boasting a 180Hz refresh rate, it minimizes motion blur, delivering smoother, more fluid animations for an enhanced gaming experience, even during fast-paced action. 16:10 aspect ratio, 3ms Overdrive Response Time, 300nit Brightness
- Internal Specifications: 16GB DDR5 Memory with 2 DDR5 Slots Total supporting Maximum 32GB, 1TB PCIe Gen 4 SSD, and microSD Card Reader for expandable storage options
If the Graphics Card column is missing
Apple states that when the column is not available, the computer has only one graphics processor. In that situation there is no integrated-versus-discrete choice for Activity Monitor to report. Do not infer discrete-GPU use from the fact that a Mac contains a powerful graphics subsystem.
The Tool Desk
Outbyte PC Repair FREEClear out junk files and repair common Windows errorsFree Scan →Outbyte Driver Updater FREEFix the driver behind crashes, sound loss and screen glitchesFind Drivers →Inspect supported NVIDIA systems from the command line
NVIDIA’s utility can provide process-level information on supported GPUs, drivers and operating systems. Open a terminal or command prompt and run:
nvidia-smiThe process section can include a process ID, process name, process type, GPU index and GPU memory usage when that information is available. Match the process name and ID to the application you are testing, and read the GPU index using the same device-mapping principle as in Task Manager.
Monitor utilization by process with pmon
For supported products and configurations, run:
nvidia-smi pmonNVIDIA documents pmon as a monitor for compute and graphics processes that can report utilization by process. It is useful when a process listing alone does not show how actively a program is running, but support depends on the GPU generation, platform and driver.
Understand the memory limitation on Windows
Process memory and instantaneous utilization are different measurements. A process can remain in the listing or hold allocated GPU memory while doing little work at the moment you observe it. NVIDIA also states that per-process GPU-memory usage is unavailable through this reporting path when Windows is operating in WDDM mode. Treat missing memory values as a reporting limitation, not proof that the app is not using the GPU.
Do these 3 things before closing this tab:
1Scan for outdated or missing drivers - takes under a minute2Repair Windows errors before they cause bigger problems3Fix the driver behind crashes, sound loss and screen glitchesWhich tool should you use?
| Tool | Platform and hardware | Per-app attribution | Device or engine detail | What it measures | Important limitation |
|---|---|---|---|---|---|
| Task Manager process view | Windows systems with supported GPU reporting | Yes, through the process row | GPU index and engine such as 3D, Compute or Video Decode | Process utilization plus engine information | Overall GPU percentage represents the busiest engine, not a full engine-by-engine total |
| Activity Monitor > Energy | MacBook Pro models with integrated and discrete GPUs | Yes, with the Graphics Card column | Whether the app uses the higher-performance discrete GPU | Per-app discrete-GPU selection | Not a universal indicator on Macs with only one graphics processor |
| Activity Monitor > GPU History | Mac | No; aggregate graph only | Overall GPU activity over time | Aggregate activity | Does not identify which process caused the activity |
nvidia-smi |
Supported NVIDIA GPUs, drivers and platforms | Yes, where the process is reported | Process type, GPU index and other listed fields | Process listing and available memory information | Features vary by hardware and driver; per-process GPU memory is unavailable in Windows WDDM mode |
nvidia-smi pmon |
Supported NVIDIA products and systems | Yes, for reported compute and graphics processes | Per-process monitoring output | Utilization by process | Support is hardware-, platform- and driver-dependent |
A practical decision path
- Windows: start the workload, open Task Manager, find the process and read GPU plus GPU engine. Map the GPU index before deciding which adapter is active.
- Dual-GPU MacBook Pro: open Activity Monitor > Energy and read Graphics Card for the app. Use Window > GPU History only for aggregate activity.
- Supported NVIDIA configuration: run
nvidia-smifor a process list andnvidia-smi pmonfor per-process monitoring when available. - No clear result: repeat the workload, check child processes and inspect non-3D engines before concluding that the GPU is idle.
Mistakes that lead to false conclusions
- Reading only total GPU percentage: total activity does not identify the app.
- Watching only the 3D graph: compute, encode and decode work can be active instead.
- Confusing memory allocation with active work: allocated memory can persist while utilization is near zero.
- Assuming a discrete chip is always selected: verify the process and adapter, especially on dual-GPU MacBook Pro models.
- Assuming every command works everywhere: NVIDIA output depends on the GPU, driver and operating mode, and Apple’s discrete-GPU column applies only to qualifying hardware.
What this guide does not establish
The documented methods above are strongest for Windows Task Manager, dual-GPU MacBook Pro models and supported NVIDIA configurations. They do not establish a single official per-app procedure for every Linux distribution or for AMD and Intel GPUs on Linux. Those systems require tools specific to their driver stack, so do not apply the Windows, Apple or NVIDIA instructions as if they were universal.
Final checklist
- Reproduce the workload while monitoring; do not check only after it ends.
- Identify the exact process, including child processes when an app uses them.
- On Windows, read both GPU and GPU engine and map the GPU index to the physical adapter.
- Consider Compute, Video Encode and Video Decode as genuine GPU work.
- On a dual-GPU MacBook Pro, use Activity Monitor > Energy > Graphics Card for per-app selection.
- Use GPU History on Mac only as an aggregate view.
- On supported NVIDIA systems, distinguish process presence, memory allocation and instantaneous utilization.
- Treat missing or unsupported fields as limits of the platform or driver, not as proof of inactivity.
In short, the reliable test is process-level observation during the workload: Task Manager’s GPU engine on Windows, Activity Monitor’s Graphics Card column on qualifying dual-GPU MacBook Pro models, or NVIDIA’s process utilities on supported NVIDIA systems. A single 3D percentage or the mere presence of a discrete chip is not enough.
Quick Recap
Product prices and availability are accurate as of the date/time indicated and are subject to change. Any price and availability information displayed on Amazon at the time of purchase will apply.

