
Quick wins for a faster PC:
Clear out junk files and repair common Windows errorsFree Scan →Scan for outdated or missing drivers - takes under a minuteDriver Scan →iTechGuides is reader-supported. When you buy through links on our site, we may earn an affiliate commission. As an Amazon Associate I earn from qualifying purchases. Learn more
The reliable way to check a newly set-up gaming PC is to establish an idle baseline, measure it during a normal game, and then compare each component with its own manufacturer specification. Record CPU temperature, GPU temperature, GPU junction temperature when available, fan speed, and any signs of throttling or lost performance. At the same time, verify that cool air can enter the case, warm air can leave it, and every fan responds to load.
There is no single “normal gaming temperature” that applies to every computer. The result depends on the exact processor and graphics card, cooler, case, room temperature, fan curve, game settings, and workload.
What you need before measuring
Temperature readings are useful only when you know what hardware produced them and under what conditions. Before launching a game, write down:
Do these 3 things before closing this tab:
1Repair Windows errors before they cause bigger problems2Fix the driver behind crashes, sound loss and screen glitches3Clear out junk files and repair common Windows errors- Exact CPU model
- Exact GPU model and, if applicable, its board partner and cooler
- PC case model
- CPU cooler model (air cooler or liquid cooler)
- Motherboard model
- Number, size, and position of case fans
Find the thermal specification or operating-limit documentation for the exact CPU and GPU. Intel directs owners to the technical documentation for the specific processor, while AMD directs users to its Product Resource Center. Graphics-card limits and sensor names also vary by model. Do not replace those limits with a generic number found in a forum.
#1 Best Overall
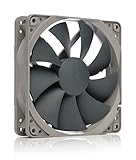
- High performance cooling fan, 120x120x25 mm, 12V, 4-pin PWM, max. 1700 RPM, max. 25.1 dB(A), >150,000 h MTTF
- Renowned NF-P12 high-end 120x25mm 12V fan, more than 100 awards and recommendations from international computer hardware websites and magazines, hundreds of thousands of satisfied users
- Pressure-optimised blade design with outstanding quietness of operation: high static pressure and strong CFM for air-based CPU coolers, water cooling radiators or low-noise chassis ventilation
- 1700rpm 4-pin PWM version with excellent balance of performance and quietness, supports automatic motherboard speed control (powerful airflow when required, virtually silent at idle)
- Streamlined redux edition: proven Noctua quality at an attractive price point, wide range of optional accessories (anti-vibration mounts, S-ATA adaptors, y-splitters, extension cables, etc.)
Note the conditions of every test: game, resolution, graphics preset, frame-rate cap, room temperature if known, and whether the side panel is installed. A result collected with the case open at a desk is not directly comparable with one collected in a closed cabinet.
Choose a way to see temperatures while you play
AMD Software: Adrenalin Edition
On compatible AMD systems, AMD Software: Adrenalin Edition can display metrics in graphs or meters, place them in an in-game overlay, and save a log. The documented interface in Adrenalin Edition 23.9.1 can expose GPU current temperature, GPU junction temperature, GPU fan speed in RPM, and CPU temperature, along with other performance indicators.
- Open AMD Software: Adrenalin Edition.
- Open the Performance section and select Metrics.
- Enable the temperature and fan metrics you want to observe, including GPU current temperature, GPU junction temperature, GPU fan RPM, and CPU temperature when available.
- Turn on the in-game metrics overlay if you need to watch values while playing.
- Enable logging when you want a time-stamped record for later comparison.
Menus and available sensors depend on the GPU, processor, driver, and system configuration. If a metric is missing, that is a support limitation rather than proof that the component has no sensor.
What’s actually slowing this PC down?
Pick the symptom - the matching free tool is one click away.
Other monitoring utilities
A GPU utility such as GPU-Z or EVGA Precision can show graphics-card temperature and fan behavior. These utilities may expose different sensor names, so identify whether a displayed value is the GPU’s current (edge) temperature, a junction or hotspot value, or another board sensor.
Motherboard firmware hardware monitor
Restart the PC and open the motherboard’s UEFI/BIOS hardware-monitor page to check idle temperatures and fan RPM without the operating system. On the cited MSI firmware, Smart Fan can set CPU, pump, and system-fan behavior against temperature. BIOS labels and controls differ by manufacturer and model. Firmware readings are useful for a baseline, but they cannot show what happens during an actual game.
A repeatable temperature-and-airflow test
1. Establish an idle baseline
After Windows has finished loading, wait several minutes without launching a game or benchmark. Record CPU temperature, GPU temperature, GPU junction temperature if exposed, and every available fan RPM. Also note whether the GPU fans are stopped at idle; many graphics cards intentionally use a zero-RPM mode, so a stationary GPU fan is not automatically a fault.
Rank #2

- HIGH STATIC PRESSURE: Efficient even with resistance – the generated airflow easily penetrates dense radiators, narrow perforated panels and mesh structures and ensures reliable cooling
- PWM CONTROL WITH WIDE SPEED RANGE: The speed can be progressively adjusted up to 3000 rpm via the 4-pin PWM connection – the fan stops completely at less than 5% PWM
- PRECISE MANUFACTURING FOR MAXIMUM SMOOTH RUNNING: Minimal gaps, automatic balancing and high-precision measurement noticeably reduce vibrations – for quiet, efficient and long-lasting performance
- SMOOTH-RUNNING FLUID DYNAMIC BEARING (FDB): The self-lubricating bearing minimizes noise during operation – ideal for quiet, efficient cooling and a long, reliable service life
- NEW FAN BLADE DESIGN FOR MORE PERFORMANCE: The redesigned rotor blades offer an optimal balance of performance and low noise – especially efficient at low speeds
Record the approximate room temperature and whether the case is in an open area or inside a desk enclosure. Save a screenshot or log so that later changes can be compared with the same baseline.
2. Use a representative game
Choose a game you actually play rather than a synthetic maximum-load test. Use a repeatable scene, save point, or built-in benchmark and keep the resolution, graphics preset, ray-tracing options, frame cap, and upscaling settings unchanged. Play or run the scene long enough for temperatures and fan speeds to settle; a quick menu visit or a two-minute launch spike is not a complete test.
3. Capture the readings
Keep the overlay visible or enable logging. Record:
- CPU temperature and, if the software provides it, CPU package power or a thermal-throttling indicator
- GPU current (edge) temperature
- GPU junction or hotspot temperature, when available
- GPU fan RPM or fan percentage
- Case, CPU-cooler, and pump RPM when the motherboard exposes them
- Frame rate, frame-time consistency, clock speed, and any reported thermal or power limit
Write down the highest sustained value and the typical settled value. A one-second peak can be informative, but it should not be treated as the whole diagnosis. Compare the same sensor, game, settings, and room conditions when testing again.
4. Check behavior, not just numbers
As the game loads the system, CPU and GPU fans should respond according to their configured curves. A fan may remain off below its start temperature and then ramp up; that is expected on some designs. What matters is whether it starts when required, reaches the expected speed, and remains connected to the correct header or pump controller.
The Tool Desk
Outbyte Driver Updater FREEFix the driver behind crashes, sound loss and screen glitchesFind Drivers →Outbyte PC Repair FREEClear out junk files and repair common Windows errorsFree Scan →Look for sudden clock-speed drops, recurring frame-time spikes, a visible thermal-throttling flag, crashes, or a sharp performance decline as the session continues. These observations often tell you more than a temperature number by itself.
Rank #3
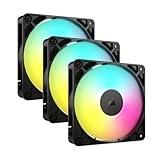
- Streamlined Fan Connections: Daisy-chain multiple fans together and control them all through just one 4-pin PWM connector and one +5V ARGB connector.
- Lighting Made Easy: Eight LEDs per fan shine bright with customisable lighting through your motherboard’s built-in ARGB control (requires compatible motherboard).
- Precise PWM Speeds: Set your fan speeds up to 2,100 RPM while providing up to 72.8 CFM airflow to your system.
- CORSAIR AirGuide Technology: Anti-vortex vanes direct airflow at your hottest components for concentrated cooling, pushing air in the direction you need when mounted to a radiator or heatsink.
- High Static Pressure: RS fans work well as radiator fans with a static pressure of 2.8mm-H2O to push through obstructions.
How to interpret CPU temperature
AMD states that CPU operating temperature depends on the cooler, system airflow, ambient temperature, custom user settings, and workload. It also connects temperature, power, and performance and recommends checking that the cooling solution is correctly rated, mounted, and functioning.
Intel cautions that temperature alone can be misleading: “Since normal operation can result in CPU temperatures being at their maximum value, it is difficult to tell purely from temperature alone if your system is having problems.” A processor may briefly reach its documented maximum during a normal workload. The relevant questions are whether it remains within the exact model’s specification, whether clocks or performance are being reduced, and whether the behavior is repeatable under your normal games.
CPU checks that provide context
- Compare the recorded value with the exact CPU’s documented thermal limit, not a generic gaming target.
- Check whether the CPU cooler is rated for the processor’s power level.
- Verify that the cooler base is fully seated and the thermal interface material was applied as the cooler instructions specify.
- Confirm that the CPU-fan or pump connector is on the intended motherboard header and is detected in firmware.
- Compare temperature with CPU package power and clock behavior; a high temperature at a very high, sustained workload can be expected, while a large performance loss indicates a separate concern.
How to interpret GPU temperature and junction temperature
NVIDIA gives a broad graphics-card temperature range of 40°C to 90°C in guidance updated September 29, 2021. That is general context, not a promise that every GPU should run at 90°C or a replacement for the limit of your exact model. Performance-class cards can reach high temperatures under heavy load.
Use the GPU manufacturer’s specification for the card you own. A current or edge temperature and a junction (hotspot) temperature are different sensors. Junction temperature is expected to be higher because it reports the hottest measured location on the die. The size of the gap matters only in the context of that card’s design, cooling, clock behavior, and documented limits; there is no universal hotspot-difference threshold that diagnoses every GPU.
GPU symptoms worth investigating
- Temperature or junction temperature reaches the card’s documented limit and clocks or frame rate fall.
- Fans remain at zero or a very low speed while the card is clearly under load and the card’s control logic should have started them.
- The temperature climbs continually throughout a normal session instead of settling.
- The game crashes, displays driver resets, or shows repeated performance drops at the same point in a workload.
Check the GPU’s power-limit and thermal-limit indicators when your monitoring software provides them. A high temperature with stable clocks and expected performance is a different case from a lower temperature accompanied by throttling or instability.
Inspecting the case airflow path
Understand intake and exhaust
Airflow is a path through the chassis, not simply a count of fans. Intel describes front-to-back airflow as common in ATX systems, while noting that vent locations, fan positions, component placement, cables, and case design change the result. Confirm the intended direction from the arrows on a fan frame or the case and fan manuals; do not assume every fan is installed the same way.
Rank #4

- 【High Performance Cooling Fan】 Automatic speed control of the motherboard through the 4PIN PWM fan cable interface, which can determine the speed according to the temperature of the motherboard, with a maximum speed of 1550RPM. Configured with up to 55cm of cable for PWM series control of fans, ideal for cases and CPU coolers.
- 【Quality Bearings】The carefully developed quality S-FDB bearings solve the problem of pc cooling fan blade shaking in lifting mode, keeping fan noise to a minimum while providing maximum cooling performance when needed and extending the life of the fan.
- [Excellent LED light] The high-brightness LED atomizing argb fan blade can effectively reflect the light, making the ARGB lighting effect softer, and it matches the cooler and case more perfectly. Up to 17 modes of light effects with ARGB support, color can be managed and synchronized through the port on motherboard.
- 【Silent Fan Size】 Model: TL-C12C-S X5, Size: 120*120*25mm, Speed: 1550RPM±10%, Noise ≤ 25.6dBA Connector: 4pin pwm, Current: 0.20A, Air Pressure: 1.53mm H2O, Air Flow: 66.17CFM, Higher air flow for improved cooling performance.
- 【Perfect Match】The PC fan can be used not only as a case fan, but is also suitable for use with a cpu cooler to create a cooling effect together, which can take away the dry heat from the case and the high temperature generated by the CPU in operation, allowing for maximum cooling; Ideal for cases, radiators and CPU coolers.
In a typical layout, front or bottom fans draw cooler room air in, while rear or top fans exhaust warmed air. The exact arrangement depends on the case and radiator placement. A fan that faces the wrong direction can recirculate warm air or fight another fan instead of improving component temperatures.
Recommended Free Tools
Physical inspection checklist
Power the computer down before putting your hands inside. Keep fingers, clothing, and tools away from moving blades; never stop a fan with your hand. Then check:
- Front, bottom, rear, and top vents are not pressed against a wall, carpet, dust filter, or desk panel.
- Dust filters are seated and not heavily clogged.
- Cables are routed away from fan blades and major intake openings.
- The graphics card is not blocking the only significant intake route.
- Every installed fan spins freely when the system is running and reaches its expected speed under load.
- The CPU cooler’s fan or liquid cooler’s pump and radiator fans are connected and detected.
- The case side panel and front panel are installed during the final test, because open-panel readings can hide a restriction.
Intel notes that additional system fans can produce mixed results. A new fan may help one chassis and do little in another if the existing vents, pressure balance, or component placement limit the path.
Independent reader supportYour contribution helps us test, update, and keep practical guides available for everyone.Before you buy another fan: diagnose the evidence
Add hardware only when the measurements point to inadequate case airflow and the chassis has a useful mounting position. NVIDIA says front-intake and rear-exhaust fans can help reduce component temperatures, but Intel recommends testing the specific combination of chassis, power supply, motherboard, and fan arrangement. An extra fan is not a required part of checking temperatures.
If you are considering a case fan, match all of these requirements:
- Physical size and mounting-hole pattern supported by the case
- Available mounting location that improves the intake or exhaust path
- Connector type and motherboard-header or hub compatibility
- Header current capacity, especially when using splitters or multiple fans
- Desired balance between airflow, static pressure, and noise
- Correct direction for the case’s existing airflow plan
Compare before-and-after sessions using the same game, settings, room conditions, case-panel state, and measurement points. Check both temperatures and fan RPM. A lower GPU temperature accompanied by a much louder fan curve may be an acceptable trade-off, while no measurable change suggests the new position is not addressing the restriction.
Best Value

- 【High Performance Cooling Fan】 Automatic speed control of the motherboard through the 4PIN PWM fan cable interface, which can determine the speed according to the temperature of the motherboard, with a maximum speed of 1550RPM. Configured with up to 55cm of cable for PWM series control of fans, ideal for cases and CPU coolers.
- 【Quality Bearings】The carefully developed quality S-FDB bearings solve the problem of pc cooling fan blade shaking in lifting mode, keeping fan noise to a minimum while providing maximum cooling performance when needed and extending the life of the fan.
- [Excellent LED light] The high-brightness LED atomizing argb fan blade can effectively reflect the light, making the ARGB lighting effect softer, and it matches the cooler and case more perfectly. Up to 17 modes of light effects with ARGB support, color can be managed and synchronized through the port on motherboard.
- 【Silent Fan Size】 Model: TL-C12C-S X3, Size: 120*120*25mm, Speed: 1550RPM±10%, Noise ≤ 25.6dBA Connector: 4pin pwm, Current: 0.20A, Air Pressure: 1.53mm H2O, Air Flow: 66.17CFM, Higher air flow for improved cooling performance.
- 【Silent Fan Size】 Model: TL-C12C-S X3, Size: 120*120*25mm, Speed: 1550RPM±10%, Noise ≤ 25.6dBA Connector: 4pin pwm, Current: 0.20A, Air Pressure: 1.53mm H2O, Air Flow: 66.17CFM, Higher air flow for improved cooling performance.
Troubleshooting by symptom
High CPU temperature immediately after setup
- Confirm the exact CPU limit and cooler requirements in the manufacturer documentation.
- Shut down and inspect that the cooler’s protective film was removed, the mounting hardware is tightened evenly, and the thermal interface material covers the contact area as instructed.
- Verify the CPU-fan or pump cable and check its RPM in UEFI/BIOS.
- Inspect intake and exhaust vents, filters, and cable routing.
- Repeat the same game test and compare performance and clock behavior.
GPU temperature rises while the fan stays off
First determine whether the card has a zero-RPM mode. If it does, the fan may be intentionally stopped at low load. Under sustained gaming load, verify that the GPU fan RPM changes and that the card is not reporting a fan fault. Check the card’s power and display connections, then consult its model-specific documentation before changing a fan curve.
Both CPU and GPU are warmer than expected
When multiple components rise together, inspect the room and case environment before blaming one cooler. Check for blocked intake or exhaust, a dust-clogged filter, reversed fan direction, a cabinet or wall immediately behind the exhaust, and a warm room. Test once with the case in open air and once in its normal position; record both results rather than relying on memory.
Only the GPU is unusually hot
Check whether the graphics card is receiving direct intake air, whether its fans and heatsink are unobstructed, and whether the GPU’s junction temperature is also elevated. Make sure the card is fully seated and that adjacent expansion cards or cables are not blocking its intakes. If temperature, clocks, or stability remain outside the card’s documentation, use the manufacturer’s support procedure.
Crashes, No Sound, or Screen Glitches?
Random freezes, missing sound and display glitches usually trace back to one bad driver. Find and replace yours safely.Free scan · under a minuteWindows Errors? Fix Them Before They Spread
Repair common Windows errors and clear accumulated junk for a smoother, more stable PC - no reinstall needed.Free scan · no reinstallTemperatures look acceptable but games stutter
Do not assume cooling is cleared solely because temperatures are moderate. Review frame-time graphs, CPU/GPU utilization, clock speeds, power limits, memory pressure, and background applications. A stutter can be unrelated to temperature, or it can occur during a brief event that your monitor did not capture. Enable logging and repeat the same scene.
How to compare changes fairly
| Comparison | Keep constant | Record |
|---|---|---|
| Before versus after a fan change | Game scene, graphics settings, resolution, frame cap, case-panel state, and room conditions | CPU temperature, GPU current and junction temperature, fan RPM, noise impression, and performance indicators |
| Two gaming sessions | Same component, sensor name, workload duration, and monitoring method | Settled temperature and sustained clocks, not just the highest instant |
| Open case versus closed case | Game and settings, test length, and room location | All temperatures, fan speeds, and any performance change |
| Different fan locations | Fan model and speed mode where possible | Direction, mounting position, header used, temperature change, and noise |
Use like-for-like comparisons. A cooler room, a lower frame cap, or a different game can change temperatures more than a hardware adjustment.
When the result is normal
A result is reassuring when the readings remain within the exact components’ documented limits, fan behavior responds as configured, clocks and frame rates stay stable, and the temperatures settle rather than climbing without end. The absolute number matters, but the combination of specification, workload, performance, and fan response is what determines whether action is warranted.
When to stop testing and seek support
Stop repeated load testing if the system shuts down, emits an unusual electrical or burning smell, shows visible cable or connector damage, or has a fan that is physically obstructed. Let the system cool, power it off, and contact the component or system manufacturer. For a newly assembled PC, photograph cable connections and cooler mounting before disassembly; those details can help support staff identify an installation problem.
Free tools Windows power users keep installed
One-click scans. No signup required.
Quick Recap
Product prices and availability are accurate as of the date/time indicated and are subject to change. Any price and availability information displayed on Amazon at the time of purchase will apply.

