
iTechGuides is reader-supported. When you buy through links on our site, we may earn an affiliate commission. As an Amazon Associate I earn from qualifying purchases. Learn more
Astronomers do not usually watch an exoplanet’s clouds or storms as a resolved picture. They measure extremely small changes in starlight, the combined brightness of a star and planet, or the planet’s own infrared emission, then use atmospheric models to infer temperature, composition and possible circulation.
The most direct “weather map” comes from a phase curve: repeated brightness measurements as a close-in planet moves through its orbit. For the hottest, short-period worlds, the changing view of the permanent dayside and nightside can reveal broad temperature differences. The result is a model-based map of hemispheres or longitudes, not a live forecast or a photograph of local weather.
What astronomers mean by “weather” on an exoplanet
On Earth, weather means local, changing conditions such as clouds, rain, winds and temperature. For a planet orbiting another star, the word is used more cautiously. A telescope generally cannot resolve a planet’s surface or cloud systems into separate pixels. Instead, astronomers infer atmospheric properties from the light that reaches the observatory.
The Tool Desk
Outbyte Driver Updater FREEFix the driver behind crashes, sound loss and screen glitchesFind Drivers →Outbyte PC Repair FREERepair Windows errors before they cause bigger problemsFix Now →Those measurements can answer different questions. A spectrum may indicate which molecules absorb light. Infrared emission can constrain the temperature of the hemisphere facing the telescope. Brightness measured repeatedly through an orbit can show whether one longitude is hotter than another. Each result depends on the planet’s orbit, the star’s behavior, the telescope’s sensitivity and the atmospheric model used to interpret the data.
#1 Best Overall

- 【Excellent Optics】Astronomical telescope features 80mm aperture 600mm(f/6.7) focal length-The big aperture can capture more light; high transmission multi-fully coated optical lens can improve light transmittance, reduce the reflection of light. It will bring you more bright and clear images.
- 【Portable & Stable】Our refractor telescope has a backbag, an adjustable aluminum tripod and an upgraded phone adapter. All accessories can be packed into the bag, which is convenient for you to carry and storage for traveling. The tripod is stable and the height can adjust from 17.7" to 52", which is suitable for adults and kids. With the phone adapter, you can take amazing photos through your phone.
- 【Easy to Operate】 This telescope is easy to assemble even for astronomy beginners and kids. You can set up easily with the detail installation manual and video. No tools are required. It’s a great astronomy gift telescope for adults, astronomy enthusiasts, beginners and kids 8-12.
- 【Optimum Magnification】Our telescope for kids and adults is equipped with two replaceable excellent-quality eyepiecesa (20mm and 9mm) for 30X and 66X magnification. A moon filter transmits only 13 percent of the incoming light and improving contrast. Also with 5x24 finderscope, you can locate objects easily. A great option for astronomy lovers to explore the moon, Saturn and Jupiter.
- 【Satisfaction Service】We provide 3 years satisfaction service. If you have any questions about the product and service, please feel free to contact us to get 24-hour technical support from our expert team. Whether observing moon or viewing planets, our telescope can meet your all needs. It’s a great telescope for adults & 8-12 kids & astronomy beginners.
Why a telescope cannot simply photograph an exoplanet storm
Most exoplanets are both faint and very close to their host stars in the sky. Even when a planet is physically far from its star, their apparent separation is usually too small for an ordinary telescope image to show a disk, cloud bands or a storm cell. The star’s glare overwhelms the planet’s light.
Consequently, astronomers usually measure the star–planet system as a combined source. The planet’s signal is often a tiny change riding on a much brighter stellar signal. Repeating observations and comparing different orbital positions allow researchers to separate those contributions statistically. The spatial detail is limited, but the light contains wavelength and time information that a single image would not provide.
1. Transit spectroscopy samples the atmospheric edge
Watching a planet cross its star
A transit occurs when the planet passes between its star and the telescope. The solid body blocks a small amount of starlight, while an additional fraction of the light travels through the thin atmospheric rim around the planet. Astronomers record spectra outside the transit and during the transit, then compare them wavelength by wavelength.
Free tools Windows power users keep installed
One-click scans. No signup required.
Identifying molecules by their absorption features
Atmospheric molecules absorb particular ranges of wavelengths. If the planet’s apparent size is slightly larger at one wavelength than another, the difference can indicate absorption in the limb of the atmosphere. Models translate those features into possible abundances or upper limits for gases and into constraints on altitude and temperature.
This technique is primarily a composition measurement. It can reveal that an atmosphere contains, or may contain, certain molecular absorbers, but it does not produce a map of the day side. It also requires a favorable transit geometry and a signal strong enough to distinguish atmospheric absorption from stellar variability, instrumental effects and other sources of noise.
2. Thermal emission and the secondary eclipse
Separating the planet when it goes behind the star
Planets emit infrared radiation according to the temperature and properties of their atmospheres. During a secondary eclipse, the planet passes behind its star. The telescope measures the combined brightness before the eclipse and the slightly lower brightness while the planet is hidden. The difference estimates the planet’s contribution to the system’s infrared light.
Rank #2

- Superior Optics: 400mm(f/5.7) focal length and 70mm aperture, fully coated optics glass lens with high transmission coatings creates stunning images and protect your eyes. Perfect full positive telescope for astronomers to explore stars and moon.
- Magnification: Come with two replaceable eyepieces and one 3x Barlow lens.3x Barlow lens trebles the magnifying power of each eyepiece. 5x24 finder scope with mounting bracket and cross-hair lines inside make locating objects easily.
- Wireless Remote: This refractor telescope includes one smart phone adapter and one Wireless camera remote to explore the nature of the world easily through the screen and take amazing celestial images.
- Adjustable Tripod: This telescope allows for many different viewing positions with a adjustable aluminum alloy tripod and a carry bag, the telescope and tripod can fit inside the bag for easy traveling and storage.
- Satisfaction: Buy with confidence from a leading manufacturer.
What an eclipse tells you
An eclipse measurement is weighted toward the hemisphere that faces the star, because that hemisphere is often the hottest and brightest part of a close-in planet. Spectral information can constrain the dayside’s temperature structure and atmospheric composition. A single eclipse does not show how temperatures vary around the planet; it is one integrated measurement of the visible hemisphere.
Outdated Drivers Are Slowing You Down
One free scan finds every outdated or missing driver and matches the right update for your exact hardware.Free scan · exact hardware matchPC Slower Than It Used to Be?
A free scan shows the junk files, broken settings and background clutter dragging Windows down - then fixes them in one click.Free scan · Windows 10 & 11The planet’s signal is faint relative to the star, so stellar activity, detector stability and the choice of baseline model matter. Astronomers normally repeat observations or combine eclipse data with spectra and other orbital measurements to reduce ambiguity.
3. Phase curves follow brightness through an orbit
Measuring the changing visible hemisphere
A phase curve is a time series of brightness measurements collected over a substantial part of the planet’s orbit, sometimes an entire orbit or more. As the planet moves, the fraction of its hot dayside and cooler nightside visible from Earth changes. The combined star–planet brightness therefore rises and falls by a very small amount.
At each time point, the telescope records the system’s light at selected wavelengths or across a spectrum. After correcting for the star and the instrument, astronomers fit the remaining pattern with atmospheric models. NASA describes the outcome in its Webb explainer this way: “By observing the planet at various times, astronomers can build up a ‘map’ of the atmospheric temperature as a function of longitude.”
Turning a light curve into a temperature pattern
The inversion is not a direct photograph. A model predicts how much radiation a planet with a particular temperature distribution would emit at each orbital phase. Researchers adjust the distribution until the predicted curve matches the observations. The result can distinguish a very hot dayside from a cooler nightside and can constrain broad longitudinal differences.
What’s actually slowing this PC down?
Pick the symptom - the matching free tool is one click away.
If the brightest part of the curve occurs before or after the expected center of the dayside, the offset can be tested against atmospheric-circulation models. Such interpretation is model-dependent: clouds, chemistry, heat transport and viewing geometry can produce similar changes in brightness. A phase curve alone does not establish a numerical wind speed.
Rank #3
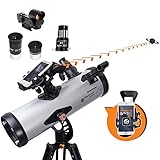
- SMARTPHONE-POWERED SKY TOUR: No experience needed! Just dock your phone, launch the StarSense Explorer app, and follow the on-screen arrows to locate stars, planets, nebulae, and more.
- PATENTED STARSENSE TECHNOLOGY: Unlike other astronomy apps, StarSense Explorer uses sky recognition technology to turn your phone into a celestial navigation system, analyzing star patterns overhead to pinpoint your telescope’s position.
- TONIGHT’S BEST TARGETS, INSTANTLY: The app generates a curated list of the top objects to see based on your time and location. See planets, bright nebulae, galaxies, and star clusters from the city—and even more from dark skies.
- SIMPLE SETUP, SMOOTH TRACKING: Features a manual altazimuth mount with altitude slow motion adjustment with a sliding rod. Follow the on-screen arrows to your target; when the bullseye turns green, you can view it clearly through the eyepiece.
- 114MM REFLECTOR WITH IMPRESSIVE VIEWS: The 4.5" Newtonian reflector with high-reflectivity coatings delivers sharp, vivid views of the Moon, planets like Jupiter and Saturn, and deep-sky favorites like the Orion Nebula and Andromeda Galaxy.
Why the method favors hot, short-period worlds
NASA says phase-curve mapping is practical mainly for the hottest planets with orbital periods of hours or days. These planets receive intense stellar heating, so their infrared contrast is comparatively large, and their rapid orbits let a telescope sample many phases in a manageable observing program. Close orbits also commonly lead to tidal locking, with one hemisphere permanently facing the star and the other permanently facing away.
A temperate planet with an Earth-like year would present a much smaller thermal signal and would require observations over a far longer interval. The method is therefore not equally useful for every exoplanet, even when the planet transits.
A concrete result: TRAPPIST-1 c
NASA’s 2025 Webb research summary reports a phase-curve result for TRAPPIST-1 c: an inferred dayside temperature of 279°C and a nightside temperature of 165°C. These are hemisphere-scale atmospheric temperatures reconstructed from changing infrared brightness, not readings from two physical thermometers and not a resolved image of the planet.
The contrast illustrates what phase curves can establish well: the two hemispheres do not radiate identically, and the difference can be quantified when the signal and models are sufficient. It does not, by itself, reveal individual clouds, rain systems or a local weather forecast.
How phase curves differ from other observing methods
| Method | What the telescope measures | Useful inference | Key constraint |
|---|---|---|---|
| Transit spectroscopy | Starlight filtered through the atmospheric limb | Atmospheric molecular signatures | Requires a favorable transit and a detectable spectral signal |
| Eclipse or thermal emission | Change in combined light when the planet is hidden | Dayside thermal emission and temperature constraints | The planet’s contribution is faint relative to the star |
| Phase curve | Brightness measured through orbital phase | Broad day–night and longitudinal temperature patterns | Most practical for hot, short-period planets |
| Direct imaging | Planet light separated from host-star glare | Planet spectrum and broad atmospheric properties | So far favors young, hot, self-luminous giant planets |
The methods are complementary. A transit can provide limb chemistry, an eclipse can constrain the dayside, and a phase curve can add information about how emission changes with longitude. Combining them reduces the number of atmospheric models that fit any one measurement.
Time-series spectra and spatially resolved data
Webb’s instruments can collect spectra at regular time intervals, allowing scientists to follow a target as its brightness or spectrum changes. This time-series approach is essential for phase curves and eclipses because the timing of every exposure affects the inferred signal.
Rank #4

- Superior Optics: Dianfan astronomy telescope features a focal length of 800 mm and a fully coated 90 mm objective lens. The large aperture gathers more light for brighter, clearer views, high-transmission coatings enhance contrast and color for sharp, vivid images for an enjoyable stargazing experience
- Powerful Magnification: With two eyepieces and a 3× Barlow lens, this telescope offers 32×–240× magnification. It allows you to observe craters and lunar seas on the surface of the Moon. With the 45° zenith mirror, images are upright and correctly oriented for terrestrial viewing, making distant targets details easier to observe. The telescope is ideal for beginners and astronomy enthusiasts
- Quick Setup & Beginner-Friendly: User-friendly design with clear instructions makes assembly simple—ready in about 15 minutes. Smooth focusing helps you quickly locate targets. Perfect for families to enjoy stargazing and explore the night sky together
- Portable & Versatile: Lightweight design with a sturdy stainless steel tripod ensures stable, steady viewing. Easy to carry in the included bag, making it perfect for travel and outdoor adventures. Suitable for stargazing, birdwatching, wildlife observation, and exploring cityscapes
- Professional Astronomical Telescope: The Dianfan 90x800 telescope combines quality , functionality and reliability. It delivers high-resolution views that bring the universe closer. Designed for adults high powered, it inspires interest in astronomy and science while encouraging exploration of the starry sky
Webb also has integral-field spectroscopy modes that record a spectrum at each image pixel in a resolved field. Those data can show how temperature, composition or motion varies across an object that the telescope can spatially resolve. This is different from an unresolved exoplanet phase curve: whether a planet can be spatially mapped depends on angular resolution, target size, distance and signal strength. A spectrum at many detector pixels does not automatically mean that individual exoplanet weather cells are visible.
Direct imaging: separating a planet from its star
Coronagraphs suppress some of a star’s glare so that an orbiting planet can be detected separately. Directly imaged planets provide their own light and spectra, which can reveal broad atmospheric properties such as temperature or molecular absorption.
NASA notes that direct images so far have mainly captured young, hot giant planets that still emit substantial internal heat. Even for those favorable targets, the observation is normally a point source or a barely resolved object. A spectrum can contain atmospheric clues, but direct imaging alone is not a detailed weather photograph.
From photons to an atmospheric map: the analysis workflow
- Select a geometrically suitable target. A transit requires the planet’s orbit to cross the stellar disk from Earth’s viewpoint. A useful phase curve requires a short period and enough planet–star brightness contrast.
- Plan a continuous observing sequence. For a phase curve, gaps can make it harder to distinguish orbital changes from instrumental drift or stellar variability. Eclipse programs include measurements before, during and after the planet disappears.
- Calibrate the detector and remove system effects. Astronomers correct for detector response, pointing changes, cosmic-ray events and other instrumental behavior before interpreting the light curve or spectrum.
- Model the host star. The star supplies most of the measured light. Stellar spectral features and time variability must be represented so that they are not mistaken for planetary absorption or emission.
- Extract the planetary signal. In transit work, this is the wavelength-dependent change caused by the atmospheric limb. In eclipse and phase-curve work, it is the much smaller change in total system brightness associated with the planet.
- Fit atmospheric models. Models vary temperature, molecular composition, clouds or hazes, and heat redistribution to calculate the spectrum or brightness pattern expected from the planet.
- Compare competing explanations. Scientists test whether different atmospheric structures produce equally good fits. Reported temperatures and compositions therefore carry assumptions and uncertainty rather than functioning as direct photographs or weather-station readings.
What these observations can and cannot establish
Usually possible with suitable data
- Detecting or constraining molecular absorption in a transiting atmosphere.
- Estimating the infrared emission and broad temperature of a planet’s dayside.
- Determining whether the dayside and nightside have substantially different inferred temperatures.
- Constraining broad temperature changes with longitude for hot, rapidly orbiting planets.
- Testing atmospheric-structure models against repeated spectra and brightness measurements.
Not established by a basic telescope measurement
- A resolved photograph of individual clouds, storms or rain systems.
- A universal weather map for planets with long orbital periods or weak thermal contrast.
- A precise wind speed for a named planet from the methods described here.
- A unique atmospheric composition when several molecular mixtures and cloud models fit the same data.
The Max Planck Institute for Astronomy identifies wind patterns, vertical temperature structure, clouds and hazes as important questions in exoplanet atmospheric studies. Those questions require suitable observations and detailed modeling; an overview of the field does not constitute a numerical wind-speed measurement for a particular world.
Common misconceptions and practical limits
“A color image shows the planet’s weather.”
A false-color map may visualize a model’s temperature or composition, but the colors represent inferred quantities. They should not be read as pixels from a camera pointed at a cloud deck.
Do these 3 things before closing this tab:
1Fix the driver behind crashes, sound loss and screen glitches2Repair Windows errors before they cause bigger problems3Scan for outdated or missing drivers - takes under a minute“One transit reveals the whole atmosphere.”
A transit samples the atmospheric edge along the star-facing silhouette. It is valuable for chemistry but does not directly sample every longitude or the nightside.
Best Value

- BRIGHT, SHARP VIEWS ANYWHERE: Unlike many beginner telescopes, this quality refractor features fully coated glass lenses and a 70mm aperture for crisp, clear views of the Moon, planets, and daytime scenery—all in a lightweight, travel-ready design.
- PERFECT FIRST TELESCOPE FOR BEGINNERS: Designed for adults and kids to enjoy together, this beginner-friendly telescope sets up in minutes and delivers rewarding views with no prior experience required.
- EASY NO-TOOL SETUP: No complicated assembly or tools needed. The full-height tripod and telescope tube set up in seconds and pack neatly into the included backpack—so you’re always ready to observe on the go.
- DUAL EYEPIECES FOR VERSATILE VIEWS: Includes 20mm and 10mm eyepieces for wide and close-up views of celestial and terrestrial targets. Spot craters on the Moon at night or wildlife during the day.
- BONUS BACKPACK AND SOFTWARE: Includes a padded backpack with room for accessories, a finderscope, star diagonal, eyepieces, and a free download of Starry Night software to help you identify celestial objects and plan your next stargazing session.
“A phase curve works for any Earth-sized planet.”
The strongest phase-curve applications involve hot worlds with short orbital periods. For cooler planets, the signal is weaker and the time needed to cover an orbit is much longer. The same observing strategy cannot simply be transferred to an Earth analog.
“A telescope accessory can reproduce the measurement.”
Professional exoplanet weather studies require highly stable space- or ground-based observatories, precise calibration and atmospheric retrieval models. An amateur telescope may detect some transits of large exoplanets, but it cannot normally measure the atmospheric or thermal signals described here.
So, can JWST measure exoplanet temperatures or winds?
JWST can measure infrared brightness and spectra precise enough to constrain temperatures for favorable targets. A phase curve can show broad day–night or longitudinal differences, as demonstrated by the TRAPPIST-1 c result. Wind circulation may be investigated indirectly through the way heat is redistributed and where modeled emission peaks, but the supplied NASA and observatory summaries do not provide a named numerical wind speed. Any such value must come from a dedicated measurement paper rather than from the existence of a phase curve alone.
The direct answer
Astronomers track distant-planet weather by monitoring light over wavelength and time. Transit spectroscopy reads the atmospheric edge, eclipses isolate dayside thermal emission, phase curves follow brightness through an orbit, and direct imaging separates a few favorable planets from their stars. The measurements are converted with physical models into broad atmospheric composition and temperature patterns.
For the hottest short-period planets, that process can distinguish a 279°C dayside from a 165°C nightside, as NASA reports for TRAPPIST-1 c. It is powerful remote sensing, but it remains inference from light—not a close-up view of clouds or a conventional weather report.
Quick Recap
Product prices and availability are accurate as of the date/time indicated and are subject to change. Any price and availability information displayed on Amazon at the time of purchase will apply.

