
The Tool Desk
Outbyte PC Repair FREEClear out junk files and repair common Windows errorsFree Scan →Outbyte Driver Updater FREEFix the driver behind crashes, sound loss and screen glitchesFind Drivers →iTechGuides is reader-supported. When you buy through links on our site, we may earn an affiliate commission. As an Amazon Associate I earn from qualifying purchases. Learn more
AI weather forecasting learns relationships between past atmospheric states and later conditions, then applies those relationships to the best available analysis of the atmosphere today. It can produce global forecasts in minutes and is increasingly used alongside physics-based numerical weather prediction (NWP), but it does not eliminate uncertainty or guarantee street-level detail. What it predicts, how far ahead it remains useful, and how much confidence to place in it depend on the model, initialization, resolution, variable and verification method.
What AI weather forecasting is
A conventional NWP system advances the atmosphere by numerically solving equations that describe fluid motion, radiation, moisture and other physical processes. An AI model takes a different route: it learns statistical relationships from many examples of atmospheric states and their subsequent states. The learned relationships are stored in the model’s weights rather than expressed as the same explicit equation-solving sequence used by an NWP model.
AI forecasting is not simply a weather app guessing from yesterday’s weather. A forecast still starts with an analyzed description of the current atmosphere, built from observations and data-assimilation systems. The AI model then maps that starting state to a future state, often in a sequence of short steps. Physics-based and AI systems now coexist in operational forecasting; the European Centre for Medium-Range Weather Forecasts (ECMWF) runs its Artificial Intelligence Forecasting System (AIFS), and NOAA operates an AI-driven global model suite.
From observations to an AI forecast
1. Assemble a long historical record
Training needs a consistent record of what the atmosphere looked like and what happened next. Inputs can include satellite observations, radar, weather-station measurements and other observing systems. Because observations are uneven in space and time, a reanalysis combines historical observations with a conventional weather model to estimate a complete, physically coherent atmospheric record.
#1 Best Overall

- [Color LCD Screen Weather Station] Newentor temperature & humidity monitor with a large color LCD display shows essential home weather information at a glance: indoor/outdoor temperature & humidity, daily high/low records, customizable alerts, time/date, alarm clock & snooze, weather forecast, moon phase, and barometric pressure.
- [Two Power Modes & Adjustable Backlight] To enjoy a 24/7 continuous always-on vibrant display, simply connect this home weather station to a wall outlet using the included DC power adapter. When operating on battery power only (batteries not included), the digital thermometer automatically enters an eco-energy-saving mode, where the screen lights up for a quick 15-second glance before dimming. It is the perfect bedside or living room clock designed to fit your power preference.
- [3-channel Home Weather Stations Wireless Indoor Outdoor] Wireless temperature forecast station supports up to 3 remote sensors to monitor inside outside temperature & humidity of multiple locations. Package contains one remote sensor.
- [Wireless Forecast Station] The weather forecast station calculates the weather forecast for the next 12-24 hours, 7 to 10 days calibration ensures an accurate personal forecast for your location.
- [Wireless Weather Station with Atomic Time&Date] Atomic alarm clock weather station can be used not only as a wireless indoor outdoor thermometer but also as an atomic clock with dual alarms.
GraphCast, a widely discussed global AI model, was trained on four decades of ECMWF ERA5 reanalysis. Reanalysis is therefore a training record, not a live forecast feed; the operational starting point for a current forecast is a separate analysis of present conditions.
2. Train on input and later states
During training, the model receives an atmospheric state and the corresponding state several hours later. It produces a prediction, compares that prediction with the later state in the training record, and calculates a loss. Backpropagation adjusts the model’s internal weights so future predictions reduce that loss. Repeating this over many historical examples teaches relationships among temperature, wind, pressure, humidity and other fields.
This process is statistical rather than a literal lookup table. The model compresses recurring patterns—such as how pressure systems tend to move and how temperature and moisture evolve—into a high-dimensional function. It can then apply that function to a weather situation it has not seen exactly before.
3. Initialize with today’s analyzed atmosphere
A trained model cannot forecast from nothing. It needs the latest analysis, which merges observations with a data-assimilation system’s estimate of the three-dimensional atmosphere. ECMWF distinguishes ERA5, used for training, from its operational analysis, used to initialize AIFS forecasts. NOAA has reported fine-tuning a GraphCast-based model with analyses from its Global Data Assimilation System; its evaluation found especially improved results when using GFS-based initial conditions.
4. Roll the forecast forward
Many systems predict one short interval and feed their own output back as the input for the next interval. GraphCast uses two atmospheric states six hours apart, predicts the state six hours after the latest one, and repeats that six-hour step to reach as far as ten days. ECMWF’s current AIFS guide describes six-hour steps extending to 360 hours, or 15 days. Those horizons belong to the named systems and should not be treated as a universal limit or promise for every AI forecast.
Rank #2

- COMPLETE WEATHER STATION: (1) Osprey Sensor Array with Rain Cup, and (1) Brilliant, Easy-to-Read LCD Color Display
- AUTHENTIC HYPER-LOCAL DATA: Monitor your actual home and backyard weather conditions with our wireless and Wi-Fi-enabled sensor array measuring wind speed/direction, temperature, humidity, rainfall, UV intensity, and solar radiation
- SMART HOME READY: Set up alerts, access your data remotely, and program your home based on weather conditions using IFTT, Google Home, Alexa, and more
- ENHANCED WIFI: Enables your station to transmit its data wirelessly to the world's largest personal weather station network (optional setting)
- JOIN THE COMMUNITY: Connect to Ambient Weather Network to customize your dashboard tiles, share hyperlocal weather conditions via social feeds and create your own forecasts (coming soon)
- Read the analyzed initial state. The model receives fields describing the atmosphere at the forecast start time.
- Predict the next state. It estimates fields at the next model time step, such as six hours later.
- Use that prediction as the next input. The system repeats the operation rather than predicting every future hour independently.
- Convert fields into products. Forecast centers can derive cyclone tracks, rainfall-risk indicators, maps, alerts and other user-facing products from the predicted fields.
What variables AI models predict
Most AI weather systems forecast atmospheric fields rather than a single label such as “rain” or “sun.” Typical fields include temperature, wind, pressure, humidity and geopotential height. A product may then calculate a derived quantity, for example a cyclone position or a probability of exceeding a temperature threshold.
GraphCast’s published configuration
| Component | Published detail |
|---|---|
| Surface variables | Five surface fields, including temperature, wind speed and direction, and mean sea-level pressure |
| Upper-air variables | Six atmospheric variables, including humidity, wind and temperature |
| Vertical levels | 37 altitude levels |
| Grid | 0.25° latitude/longitude, approximately 28 km by 28 km at the equator |
| Forecast step | Six hours, repeated to extend the forecast |
A grid of roughly 28 km does not describe every neighborhood, valley or thunderstorm cell. It is a global, medium-range representation. Local providers may downscale or post-process it with higher-resolution models, terrain information and observations, but that additional processing is a separate step from the global AI forecast.
Weather patterns and hazards it can help predict
Broad medium-range circulation
NOAA’s 2025 Spring Forecasting Experiment evaluated seven-day global AI emulators. During the first week, the systems generally captured the placement and timing of broad 500-mb pressure patterns. These large-scale patterns help indicate where ridges, troughs and storm tracks are likely to develop, even when the exact local weather remains uncertain.
Cyclone movement
GraphCast’s publisher reported improved cyclone-track forecasts relative to ECMWF’s deterministic HRES in its evaluation and highlighted an example involving Hurricane Lee. That is a model-publisher result for the stated evaluation, not a guarantee for every storm, basin or lead time. Track guidance also does not by itself provide the complete wind, surge, rainfall or evacuation-impact forecast for a location.
Atmospheric rivers and flood-related risk
AI forecasts can identify and characterize atmospheric rivers—long corridors of concentrated moisture. Their predicted intensity and path can help indicate whether an event is more likely to bring useful precipitation or a potentially flood-producing deluge. An atmospheric-river signal is an indicator of a large-scale setup, not a finished local flood-impact assessment; terrain, drainage, soil conditions and short-lived convective rainfall still matter.
Rank #3
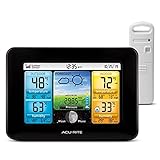
- Simple Setup and Use: Install 2 AA batteries (not included) in the outdoor weather station sensor and easily hang on a post or tree branch using the integrated hanger to begin receiving your weather forecast and hyperlocal conditions
- Real-Time Weather Conditions: This indoor outdoor weather station has an indoor temperature gauge and an outdoor temperature thermometer for indoor and outdoor temperature, humidity, and barometric pressure trends from an outdoor temperature sensor
- Weather Forecast and Forecasting Technology: The outside temperature thermometer wirelessly relays data to provide a hyperlocal, personalized weather forecast 12 hours from your current conditions, so you can plan your la crosse or other sports game!
- Illuminated LCD Color Display: Easy-to-view digital indoor outdoor thermometer display has an adjustable dimmer to make for the perfect addition to your home technology and allows easy placement anywhere in the house, office, or as an RV weather station
- Dynamic Forecast Icons and Moon Phase: With multiple thermometers & weather instruments data, this digital indoor outdoor thermometer display has trend arrows and provides the current moon phase to further impact your weather monitoring capabilities
Extreme temperatures
GraphCast’s publisher reports that it can predict the onset of extreme temperatures. Such a signal is most useful when read with its lead time, geographic scale and probability or ensemble information. A global grid can indicate an impending heat or cold episode without determining the exact maximum temperature at an individual address.
Recommended Free Tools
Weather-sensitive planning
Medium-range AI guidance can inform renewable-energy scheduling, event logistics, transport planning and other decisions that depend on broad weather patterns. The value is usually in earlier scenario awareness and consistent updates, not in treating one deterministic map as certain.
How accurate are AI weather forecasts?
There is no single independent ranking that makes one AI model the most accurate for every variable, region and lead time. Published results are conditional on the data used to initialize the model, the forecast horizon, the grid, the benchmark and the verification method.
| Result | Scope and qualification |
|---|---|
| More than 90% of 1,380 tested variables and lead times | Google DeepMind’s 2023 GraphCast explainer says GraphCast was more accurate than ECMWF deterministic HRES on this set. It is the publisher’s evaluation claim, not a universal ranking. |
| 99.7% of tested tropospheric variables | The same 2023 publisher evaluation, restricted to the troposphere. |
| Median subjective scores of 5.4–5.6 versus 5.1 for GFS | NOAA’s 2025 Spring Forecasting Experiment ratings for the three top GFS-initialized AI emulators versus GFS over five weeks of seven-day forecasts. |
| ECMWF-initialized comparison | NOAA reported that the ECMWF rating was not statistically significantly different from the top three AI emulators at the 95% confidence level in that experiment. |
NOAA’s experiment also found trade-offs. Some AI systems smoothed wind and geopotential-height gradients, and their quantitative precipitation forecasts were often smoother and less detailed than NWP guidance. In disagreements, an AI emulator sometimes placed a dominant trough or ridge better than the operational model, but performance varied by case and initialization.
Why forecasts remain uncertain
Chaotic initial conditions
The atmosphere is chaotic: tiny errors in the starting state can grow as a forecast moves forward. Observations are incomplete, and no analysis captures every cloud, gust or small temperature variation. As ECMWF puts it, “This means that all forecasts will have some uncertainty associated with them.”
Quick wins for a faster PC:
Scan for outdated or missing drivers - takes under a minuteDriver Scan →Clear out junk files and repair common Windows errorsFree Scan →Fix the driver behind crashes, sound loss and screen glitchesFind Drivers →Rank #4

- Comprehensive Weather Information: One of the best weather stations, receive over 55 data points that allow you to monitor historical data, the heat index, dew point, feels like temperature, pressure trends with trend arrow, and more
- Real-Time Weather Conditions: Look no further for the perfect indoor and outdoor weather station! Wirelessly receive readings for indoor/outdoor temperature and humidity, wind speed/direction, barometric pressure, and rainfall directly to your home weather station
- Easiest Setup on the Market: Just install batteries, attach the wireless outdoor sensor to a pole or post using the included mounting bracket, and you’re ready to be the neighborhood weather expert
- Weather Clock: The indoor weather station display is a large, color LCD Display with the current time, date, and an adjustable dimmer, making it convenient to read and easily view indoor and outdoor data, time, and conditions
- Weather Forecast: The outdoor weather station collects elevation data and combines it with barometric pressure data from the indoor weather station to provide a personalized weather forecast 12 hours from your current conditions
Loss of small-scale detail
Global AI models can score well on broad patterns while missing shorter-wavelength features, especially at longer lead times. Smoothing may weaken sharp wind shifts, pressure gradients and precipitation structures. A model that is skillful at a continental-scale ridge can still be unsuitable for deciding whether one neighborhood will receive a thunderstorm.
Physical consistency is not automatic
When variables are predicted as separate fields, they may not align perfectly. ECMWF notes, for example, that forecast wind may not match the pressure or height gradient implied by another predicted field. Additional physical checks, post-processing or blending with NWP may be needed before turning raw fields into a public product.
Limited interpretability
AI weights do not provide the same intuitive explanation as a known physical process. Forecast users may need local post-processing and meteorological interpretation to understand why a model produced a result or whether a rare pattern is trustworthy.
Independent reader supportYour contribution helps us test, update, and keep practical guides available for everyone.How to compare two AI or NWP forecasts
Do not compare headline percentages without matching the conditions of the test. Use this checklist:
- Lead time: A seven-day score says little about a six-hour nowcast or a 24-hour local rainfall forecast.
- Variable and scale: Broad pressure, temperature, wind, cyclone track and fine-scale precipitation measure different skills.
- Initialization: Identify whether the model started from GFS, ECMWF or another analysis. NOAA’s experiment found that initialization changed results.
- Resolution: Check the grid spacing and whether downscaling or local terrain corrections were applied.
- Benchmark: Distinguish an objective numerical score from a blinded human rating, and identify the reference model or verifying analysis.
- Uncertainty: Prefer products that show ensembles or probabilities when a decision carries meaningful risk.
Deterministic versus probabilistic AI forecasts
A deterministic forecast presents one predicted state. It is easy to read, but it can hide how sensitive the result is to initial-condition errors or model limitations. A probabilistic forecast presents a range of plausible outcomes or the chance of an event. ECMWF explains that probability forecasts make forecast error explicit and remind users to account for uncertainty. “60% chance of heavy rain” means the event is plausible and decision-relevant; it does not promise that heavy rain will occur, nor does a 40% non-occurrence chance mean the forecast failed if it does not.
Best Value

- Illuminated Indoor Outdoor Weather Station for Home with Large Colorful Display: The home weather station delivers large big numbers for weather forecast info, indoor outdoor temperature, atomic time, date, year and calendar day, which is super easy to read from afar.
- Indoor outdoor Thermometer Wireless with High/Low Temperature Alert: The digital weather station supports 3 outdoor sensors which helps to monitor temperature and humidity of multiple locations (one sensor included). With the high/low temperature alert function, the weather station clock keeps you informed about the changes of weather thermometer outdoor.
- WWVB Atomic Weather Station with Auto DST: Weather atomic clock with indoor/outdoor temp always keeps precise time and date by receiving the WWVB atomic signal. The self setting digital weather clock will automatically adjust to daylight saving time with auto DST feature, no more resetting twice a year.
- Personal Weather Forecast Station: This weather stations wireless indoor outdoor predicts the next 12-24 hours weather condition with a 7-day calibration through the pressure of your location which provides you a better outing experience.
- 5 Level Adjustable Backlight Brightness: The weather clock indoor outdoor temperature atomic with backlight dimmer function helps you avoid high-intensity light that disturb your sleep and easily check the weather situation during the day.
For operational decisions, compare probabilities with a predefined action threshold. For example, an event organizer might move an outdoor activity when the probability of disruptive rain exceeds its tolerance, while a utility may use a range of wind scenarios rather than one wind value.
What AI forecasting does—and does not—replace
AI can generate a global forecast rapidly once it has been trained. Speed can support more frequent updates, larger ensembles or faster scenario testing. It does not remove the need for data assimilation, observation networks, verification, meteorological oversight or local models. Conventional NWP remains part of the forecasting landscape, and operational centers can use AI output alongside physics-based guidance.
For a reader choosing a weather service, the most useful questions are not “Is it AI?” but “Which analysis initialized it, what resolution does it use, how far ahead is this product, what variable is being verified, and how does it communicate uncertainty?”
Do these 3 things before closing this tab:
1Repair Windows errors before they cause bigger problems2Scan for outdated or missing drivers - takes under a minute3Clear out junk files and repair common Windows errorsA practical way to read an AI-generated forecast
- Note the forecast issue time and the valid time. A map made today for tomorrow is a different product from one made today for day ten.
- Identify the variable: temperature, wind, pressure, precipitation, cyclone position or a derived hazard indicator.
- Check the spatial scale and whether the map is global, regional or locally downscaled.
- Look for an ensemble spread, probability, confidence band or alternative model guidance.
- Compare at least one independent forecast source when the decision is safety-critical.
- Recheck as the event approaches; later analyses usually contain more observations and shorter lead times.
AI-powered forecasting is best understood as a fast, data-trained way to evolve an analyzed atmospheric state. It can be highly effective for broad medium-range patterns and useful hazard guidance, while its smooth fields, imperfect variable consistency and sensitivity to initialization limit fine local certainty. Treat every result as a forecast with a stated scope—not as a guarantee.
Quick Recap
Product prices and availability are accurate as of the date/time indicated and are subject to change. Any price and availability information displayed on Amazon at the time of purchase will apply.

