
The Tool Desk
Outbyte PC Repair FREERepair Windows errors before they cause bigger problemsFix Now →Outbyte Driver Updater FREEFix the driver behind crashes, sound loss and screen glitchesFind Drivers →iTechGuides is reader-supported. When you buy through links on our site, we may earn an affiliate commission. As an Amazon Associate I earn from qualifying purchases. Learn more
GPU temperature is the core or general die-temperature value exposed by a monitoring tool. Hot spot temperature—also called junction temperature on some AMD documentation—is the highest reading from many sensors distributed across the GPU die. The hot spot is therefore usually higher, but there is no manufacturer-defined, universal “normal” difference that applies to every graphics card, workload, or utility.
The number that determines whether a temperature is a problem is your exact GPU model’s specified operating limit, together with evidence of throttling, a thermal-violation flag, instability, or shutdown. A hot spot reading by itself is not a diagnosis.
GPU temperature and hot spot temperature are different measurements
Modern GPUs contain multiple thermal sensors. A monitoring program may show one summary value for the GPU core and another value for the hottest sensor location. Those fields describe different parts of the silicon, so comparing them as if they were two thermometers placed in the same spot leads to bad conclusions.
Do these 3 things before closing this tab:
1Clear out junk files and repair common Windows errors2Fix the driver behind crashes, sound loss and screen glitches3Repair Windows errors before they cause bigger problems| Reading | What it represents | How to use it |
|---|---|---|
| GPU temperature, GPU Current Temp, or core temperature | A vendor-defined GPU/core temperature field. NVIDIA describes GPU Current Temp as “Core GPU temperature.” | Use it to follow the general thermal state and compare runs on the same card and workload. |
| GPU hot spot | The highest temperature measured from a collection of junction sensors on the GPU die. AMD GPUOpen states: “GPUHotspotTemperature reports the highest temperature measured on the die of the GPU from a collection of junction temperature sensors on the die.” | Use it to identify the hottest point on the die and to check whether that point is approaching the model’s limit. |
| Junction temperature | A name sometimes used for the same hottest-sensor concept as GPU hot spot. | Confirm the utility’s field definition; labels are not identical across vendors and applications. |
| Memory temperature | A separate reading for supported memory devices, not the GPU-core reading. | Assess memory thermals independently. A cool core does not prove that memory is cool. |
Sensor availability varies by product. NVIDIA’s documentation cautions that not every product supports every temperature-reading type, and its interface lists GPU current temperature and memory current temperature as separate fields. If a utility does not display a hot spot or memory value, that can reflect hardware or driver support rather than a missing sensor in the physical card.
#1 Best Overall
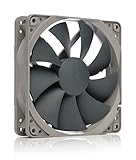
- High performance cooling fan, 120x120x25 mm, 12V, 4-pin PWM, max. 1700 RPM, max. 25.1 dB(A), >150,000 h MTTF
- Renowned NF-P12 high-end 120x25mm 12V fan, more than 100 awards and recommendations from international computer hardware websites and magazines, hundreds of thousands of satisfied users
- Pressure-optimised blade design with outstanding quietness of operation: high static pressure and strong CFM for air-based CPU coolers, water cooling radiators or low-noise chassis ventilation
- 1700rpm 4-pin PWM version with excellent balance of performance and quietness, supports automatic motherboard speed control (powerful airflow when required, virtually silent at idle)
- Streamlined redux edition: proven Noctua quality at an attractive price point, wide range of optional accessories (anti-vibration mounts, S-ATA adaptors, y-splitters, extension cables, etc.)
Why the hot spot is higher
GPU workloads do not heat every part of a die equally. Shader arrays, cache blocks, memory controllers, and other circuits draw different amounts of power at different moments. The cooler, heatsink contact, thermal interface material, and mounting pressure also distribute heat unevenly. A set of junction sensors captures that spatial variation; the hot spot is simply the maximum value in the set.
The core value is a summary field whose exact calculation depends on the vendor and monitoring interface. It may not be the arithmetic average of all sensors, and two utilities can expose different names or fields for what a user informally calls “GPU temperature.” Always read the field label and unit shown by the tool instead of assuming that every temperature number is equivalent.
Hot spot is not a second GPU
The hot spot does not mean that the entire die is operating at that temperature. It identifies the warmest measured location at that instant. A card can therefore report a moderate core value and a substantially warmer hot spot while still operating as designed. The practical question is whether the hot spot reaches the model’s documented limit or coincides with a thermal response such as clock reduction.
Free tools Windows power users keep installed
One-click scans. No signup required.
There is no universal normal hot-spot delta
People often ask whether a hot spot that is 10, 20, or 30 degrees higher than the GPU temperature is “normal.” Official documentation defines the readings and limits but does not establish one universal hot-spot-minus-core range for all GPU models. The difference changes with architecture, cooler design, mounting, workload, fan behavior, ambient temperature, and the fields a particular utility reports.
Rank #2

- HIGH STATIC PRESSURE: Efficient even with resistance – the generated airflow easily penetrates dense radiators, narrow perforated panels and mesh structures and ensures reliable cooling
- PWM CONTROL WITH WIDE SPEED RANGE: The speed can be progressively adjusted up to 3000 rpm via the 4-pin PWM connection – the fan stops completely at less than 5% PWM
- PRECISE MANUFACTURING FOR MAXIMUM SMOOTH RUNNING: Minimal gaps, automatic balancing and high-precision measurement noticeably reduce vibrations – for quiet, efficient and long-lasting performance
- SMOOTH-RUNNING FLUID DYNAMIC BEARING (FDB): The self-lubricating bearing minimizes noise during operation – ideal for quiet, efficient cooling and a long, reliable service life
- NEW FAN BLADE DESIGN FOR MORE PERFORMANCE: The redesigned rotor blades offer an optimal balance of performance and low noise – especially efficient at low speeds
Use the difference as a trend and troubleshooting clue, not as a pass/fail threshold. Record both values on the same card under the same workload. A changing gap, an unusually large gap for that card, or a gap that appears alongside throttling deserves investigation; the gap alone does not prove a defective GPU, cooler, or thermal paste.
| Observed pattern | What it can tell you | What it cannot prove |
|---|---|---|
| Core and hot spot rise together during a sustained workload | The die is responding to increased power and heat. Check the model limit and whether clocks remain stable. | It does not by itself show that cooling has failed. |
| Hot spot rises faster than the core | Heat is concentrated at one or more die locations, or the two fields are calculated differently. | It does not establish a universal unsafe delta. |
| Hot spot is high and a throttle/thermal-violation indicator is active | The card is encountering a thermal control condition; investigate cooling, airflow, ambient temperature, and dust. | It does not identify which physical component needs replacement. |
| Hot spot is high but the card remains below its specified limit with no throttling | Continue monitoring under a repeatable workload and compare with the manufacturer’s specification. | It does not guarantee unlimited thermal headroom. |
Use the exact GPU model’s limit, not a universal “safe temperature”
NVIDIA states plainly: “This maximum temperature varies by GPU.” The maximum specified operating temperature, slowdown temperature, target temperature, and shutdown behavior are model- and product-dependent. A temperature that is acceptable for one card may be too close to the limit for another.
When a GPU reaches its maximum specified operating temperature, NVIDIA describes performance throttling as a protective response. If the temperature continues to rise despite throttling, the system may shut down. This is why a high number matters most when it is close to the documented limit or accompanied by measurable performance reduction, a thermal violation, artifacts, driver recovery, or shutdown.
Outdated Drivers Are Slowing You Down
One free scan finds every outdated or missing driver and matches the right update for your exact hardware.Free scan · exact hardware matchWindows Errors? Fix Them Before They Spread
Repair common Windows errors and clear accumulated junk for a smoother, more stable PC - no reinstall needed.Free scan · no reinstallUnderstand NVIDIA’s temperature fields
NVIDIA monitoring interfaces can expose current temperature alongside slowdown, maximum operating, shutdown, and target-temperature fields. The T.Limit value is a margin from the maximum operating temperature, not an absolute temperature. A negative or shrinking margin therefore should not be read as another independent thermometer.
Rank #3
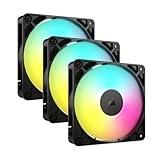
- Streamlined Fan Connections: Daisy-chain multiple fans together and control them all through just one 4-pin PWM connector and one +5V ARGB connector.
- Lighting Made Easy: Eight LEDs per fan shine bright with customisable lighting through your motherboard’s built-in ARGB control (requires compatible motherboard).
- Precise PWM Speeds: Set your fan speeds up to 2,100 RPM while providing up to 72.8 CFM airflow to your system.
- CORSAIR AirGuide Technology: Anti-vortex vanes direct airflow at your hottest components for concentrated cooling, pushing air in the direction you need when mounted to a radiator or heatsink.
- High Static Pressure: RS fans work well as radiator fans with a static pressure of 2.8mm-H2O to push through obstructions.
For supported products, run:
nvidia-smi -q -d TEMPERATUREReview the exact field names, units, and limits returned for your card. The command’s output is product-dependent; do not copy a limit from a different model or assume that every listed field is available on every board.
Understand AMD’s generation-specific checks
AMD’s monitoring guidance differs by GPU generation. For Instinct MI300 series and newer, AMD SMI documentation describes checking hot spot temperature together with thermal-violation percentages. For Radeon Navi and Instinct MI100/MI200 products, the documented path uses throttle status and reason flags instead; the violation API can be unavailable or report N/A on those generations.
AMD gives “>95°C” as an example condition when discussing high hot spot temperature together with high TVIOL on Instinct MI300-series-and-newer hardware. That is a generation-specific monitoring example, not a general consumer-GPU safety threshold. Use the commands and APIs supported by your GPU generation and driver rather than treating that number as a universal limit.
Quick wins for a faster PC:
Fix the driver behind crashes, sound loss and screen glitchesFind Drivers →Repair Windows errors before they cause bigger problemsFix Now →How to monitor temperatures reliably
1. Identify the exact card and software context
- Record the manufacturer, board model, GPU generation, driver version, and whether the card is a desktop, mobile, workstation, or data-center product.
- Note which utility produced each value and the exact field names it displays. “GPU,” “core,” “junction,” “hot spot,” and “memory” are not interchangeable labels.
- Record ambient room temperature, fan mode, power limit, overclock or undervolt settings, and whether the case side panel is installed.
2. Reproduce a comparable workload
Temperature comparisons are meaningful only when the workload and duration are comparable. Log idle temperatures separately from a sustained game, rendering job, compute task, or stress test. Capture the peak and the stabilized value, along with GPU utilization and clock behavior. A brief spike and a temperature held for 30 minutes are different thermal events.
Rank #4

- 【High Performance Cooling Fan】 Automatic speed control of the motherboard through the 4PIN PWM fan cable interface, which can determine the speed according to the temperature of the motherboard, with a maximum speed of 1550RPM. Configured with up to 55cm of cable for PWM series control of fans, ideal for cases and CPU coolers.
- 【Quality Bearings】The carefully developed quality S-FDB bearings solve the problem of pc cooling fan blade shaking in lifting mode, keeping fan noise to a minimum while providing maximum cooling performance when needed and extending the life of the fan.
- [Excellent LED light] The high-brightness LED atomizing argb fan blade can effectively reflect the light, making the ARGB lighting effect softer, and it matches the cooler and case more perfectly. Up to 17 modes of light effects with ARGB support, color can be managed and synchronized through the port on motherboard.
- 【Silent Fan Size】 Model: TL-C12C-S X5, Size: 120*120*25mm, Speed: 1550RPM±10%, Noise ≤ 25.6dBA Connector: 4pin pwm, Current: 0.20A, Air Pressure: 1.53mm H2O, Air Flow: 66.17CFM, Higher air flow for improved cooling performance.
- 【Perfect Match】The PC fan can be used not only as a case fan, but is also suitable for use with a cpu cooler to create a cooling effect together, which can take away the dry heat from the case and the high temperature generated by the CPU in operation, allowing for maximum cooling; Ideal for cases, radiators and CPU coolers.
3. Choose a tool that exposes the fields you need
NVIDIA identifies GPU-Z and EVGA Precision as examples of utilities that can monitor NVIDIA GPU temperature. NVIDIA’s own nvidia-smi provides a command-line route on supported products. These tools may not expose identical sensors or limits for every card.
AMD SMI provides temperature and throttle or violation monitoring, but support depends on GPU generation. On hardware where a particular API is unavailable, use the documented throttle-status or reason flags instead of interpreting an absent value as zero.
4. Keep one source of truth for a comparison
Do not compare a core value from one application with a hot spot value from another and then infer a hardware change. Use one utility, the same driver state, the same workload, and the same logging interval whenever possible. If two tools disagree, compare their field definitions and units first.
What to do when temperatures or hot spot values are high
Work from the least invasive checks to the most involved. A high reading does not justify replacing thermal paste or a GPU fan until the evidence points to a cooling fault.
Best Value

- 【High Performance Cooling Fan】 Automatic speed control of the motherboard through the 4PIN PWM fan cable interface, which can determine the speed according to the temperature of the motherboard, with a maximum speed of 1550RPM. Configured with up to 55cm of cable for PWM series control of fans, ideal for cases and CPU coolers.
- 【Quality Bearings】The carefully developed quality S-FDB bearings solve the problem of pc cooling fan blade shaking in lifting mode, keeping fan noise to a minimum while providing maximum cooling performance when needed and extending the life of the fan.
- [Excellent LED light] The high-brightness LED atomizing argb fan blade can effectively reflect the light, making the ARGB lighting effect softer, and it matches the cooler and case more perfectly. Up to 17 modes of light effects with ARGB support, color can be managed and synchronized through the port on motherboard.
- 【Silent Fan Size】 Model: TL-C12C-S X3, Size: 120*120*25mm, Speed: 1550RPM±10%, Noise ≤ 25.6dBA Connector: 4pin pwm, Current: 0.20A, Air Pressure: 1.53mm H2O, Air Flow: 66.17CFM, Higher air flow for improved cooling performance.
- 【Silent Fan Size】 Model: TL-C12C-S X3, Size: 120*120*25mm, Speed: 1550RPM±10%, Noise ≤ 25.6dBA Connector: 4pin pwm, Current: 0.20A, Air Pressure: 1.53mm H2O, Air Flow: 66.17CFM, Higher air flow for improved cooling performance.
- Check the model specification. Find the maximum operating and slowdown limits for the exact GPU and board. Do not borrow a limit from a similar-looking card.
- Check for an active thermal response. Look for clock reduction, a thermal-violation percentage, throttle status, a throttle reason flag, driver recovery, visual artifacts, or shutdown. A high number without any response is interpreted differently from a high number that is actively limiting performance.
- Verify the workload. Reproduce the reading with a known, sustained workload and note utilization, power, clocks, and duration. A short burst may not represent steady-state cooling.
- Inspect ambient conditions. A hotter room raises the temperature of every component. Record the room temperature before comparing readings from different days or seasons.
- Inspect case airflow. Confirm that intake and exhaust fans run, vents are not blocked, cables are not obstructing the GPU, and the graphics-card fans follow their expected curve.
- Remove accumulated dust. Dust on filters, heatsink fins, and fan blades restricts airflow. Power down, unplug the system, and use a manufacturer-approved cleaning method; avoid forcing a fan to spin freely with compressed air.
- Return experimental settings to stock. Temporarily remove an overclock, aggressive power limit, or undervolt so the thermal behavior can be compared with the card’s baseline configuration.
- Improve airflow only when the case is the bottleneck. NVIDIA says, “If a GPU is hitting the maximum temperature, improved system cooling via an added system fan in the PC can help to reduce temperatures.” Check mounting compatibility and the case’s intake/exhaust layout before adding hardware; a fan is not automatically required for every elevated hot spot reading.
- Escalate only with supporting evidence. Persistent limit-reaching temperatures, abnormal fan behavior, repeated throttling, artifacts, or shutdowns after airflow and dust checks may justify contacting the board manufacturer or a qualified technician. A hot-spot difference alone is not enough evidence to recommend thermal-paste or GPU-fan replacement.
How to interpret common temperature scenarios
High core, high hot spot, no throttling
First compare both values with the exact model’s maximum operating temperature. If they remain below the limit and performance is stable, continue monitoring under repeatable conditions. The absence of a universal delta means the relationship between the two values is less useful than the documented limit and actual behavior.
Hot spot reaches the limit before the core
This is possible because the hot spot is the maximum of several die sensors. Confirm that the utility is reporting a genuine hot-spot or junction field, then check for clock reduction or a thermal-violation indicator. Inspect airflow, dust, ambient temperature, and fan operation before considering any repair.
Temperatures are acceptable, but performance drops
Thermal throttling is only one possible cause of lower performance. Check clocks, utilization, power limits, driver behavior, and application settings. A temperature number below a limit does not prove that a performance problem is thermal, and a hot spot number should be correlated with the time of the slowdown.
Memory temperature is high while GPU temperature is moderate
Memory is reported separately on supported products and can have different cooling contact and limits. Investigate the memory field and the product’s memory specification rather than using the core or hot-spot value as a substitute.
A utility shows no hot spot value
Check whether the GPU and driver expose that sensor. NVIDIA notes that not all products support every reading type, and AMD’s monitoring APIs vary by generation. An unavailable field is not evidence that the die has no temperature sensors or that the card is overheating.
Common interpretation mistakes
- Applying a single “safe” number to every GPU. Maximum temperature varies by model and product class.
- Treating the hot spot as the average die temperature. It is the highest sensor reading, not a statement that the entire die is equally hot.
- Assuming a fixed hot-spot delta. Official documentation does not define one cross-model normal gap.
- Confusing a margin with a temperature. NVIDIA’s
T.Limitis a margin from the maximum operating temperature. - Ignoring memory temperature. Memory and GPU-core fields are separate, and memory readings are available only on supported products.
- Comparing different cards by raw temperature. Compare model limits, sensor fields, workload, ambient conditions, and cooling configuration together.
- Replacing parts based on one screenshot. Establish a repeatable pattern and look for throttling or other thermal symptoms first.
A practical decision framework
| Question | If the answer is yes | If the answer is no |
|---|---|---|
| Is the exact model’s documented limit known? | Compare core and hot spot values with that limit. | Identify the model and obtain its manufacturer specification before judging the reading. |
| Is throttling, a thermal violation, or a throttle reason active? | Investigate cooling, airflow, dust, ambient temperature, and settings. | Continue with repeatable monitoring; do not diagnose from the delta alone. |
| Does the issue reproduce under the same workload? | Log peak and stabilized values and correlate them with clocks and performance. | Gather comparable data before changing hardware. |
| Are fans, vents, and filters clean and operating? | Move to model-specific support if limit-reaching behavior persists. | Correct airflow or dust restrictions and retest. |
Bottom line for GPU versus hot spot temperature
GPU temperature is a general or core reading; hot spot/junction temperature is the hottest point found by multiple die sensors. A higher hot spot is expected in principle, but no universal temperature gap or safe threshold applies across GPUs. Judge the reading against the exact model’s documented limit, verify whether the card is throttling or reporting a thermal violation, and troubleshoot airflow, dust, ambient temperature, and fan behavior before considering repair.
Quick Recap
Product prices and availability are accurate as of the date/time indicated and are subject to change. Any price and availability information displayed on Amazon at the time of purchase will apply.

