
Quick wins for a faster PC:
Repair Windows errors before they cause bigger problemsFix Now →Scan for outdated or missing drivers - takes under a minuteDriver Scan →iTechGuides is reader-supported. When you buy through links on our site, we may earn an affiliate commission. As an Amazon Associate I earn from qualifying purchases. Learn more
To monitor CoreWeave stock, follow six connected layers rather than a single headline number: revenue growth and its quality; GAAP operating and net losses; adjusted EBITDA with its reconciliation to GAAP results; backlog and conversion; power capacity, capital expenditure and depreciation; and debt, liquidity, interest expense and customer concentration. CoreWeave’s latest cited quarter, Q2 2026 (ended June 30, 2026), shows why the full set matters: revenue reached $2.575 billion, but the company reported a $49 million operating loss, a $626 million net loss and $640 million of net interest expense.
The Q2 2026 snapshot: rapid growth with substantial financing and investment costs
The following figures are from CoreWeave’s reported second quarter of 2026. They should be read together because no single metric describes the economics of an AI-infrastructure operator.

| Metric | Q2 2026 result | Why it matters |
|---|---|---|
| Revenue | $2.575 billion | Measures recognized activity during the quarter and the scale of customer deployments. |
| Year-over-year revenue comparison | $1.212 billion in Q2 2025 versus $2.575 billion in Q2 2026 | Shows very rapid expansion, but not whether new capacity is earning attractive returns. |
| GAAP operating income (loss) | $(49) million | Includes operating costs such as depreciation and stock compensation; it remained negative. |
| GAAP net income (loss) | $(626) million | Reflects operating results plus interest and other non-operating items. |
| Net interest expense | $640 million | Shows how much financing cost reduced pretax earnings in the quarter. |
| Diluted net loss per share | $1.14 | Translates the net loss into an approximate per-share result after dilution. |
| Adjusted EBITDA | $1.510 billion | A non-GAAP measure of earnings before interest, taxes, depreciation and amortization, plus CoreWeave’s specified adjustments. |
| Adjusted EBITDA margin | 59% | Indicates high reported operating cash-earnings potential before major capital and financing costs. |
| Adjusted operating income | $128 million | Provides a less aggressive bridge between adjusted performance and GAAP operating income. |
| Adjusted operating margin | 5% | Shows how much narrower profitability is after more operating costs than EBITDA includes. |
The contrast is the central monitoring issue. Adjusted EBITDA was $1.510 billion, while GAAP operating income was negative $49 million and net loss was $626 million. Investors should investigate every reconciliation item instead of treating EBITDA as a substitute for profit or free cash flow.
Recommended Free Tools
1. Revenue growth: measure quality, not just speed
Track quarterly revenue and the year-over-year rate
Start each earnings update with reported revenue and year-over-year growth. CoreWeave’s Q2 2026 revenue of $2.575 billion was more than double the $1.212 billion reported for Q2 2025. The growth rate is important, but an infrastructure company can grow quickly while spending even faster on GPUs, facilities and financing.
Separate demand from deployment timing
Ask what produced the quarter’s revenue:
- Were new customers activated?
- Did existing customers expand their committed capacity?
- Were previously delayed deployments finally brought online?
- Did pricing, utilization or contract mix change?
Delayed deployments can make one quarter look weak and the next unusually strong without changing the underlying demand trend. Compare revenue growth with active power brought online, deployed GPU capacity and backlog conversion to identify that timing effect.
Use revenue per active power unit as a productivity check
CoreWeave reported 1.5 gigawatts (GW) of active power. A useful internal indicator is revenue generated per active megawatt or GW over a comparable period. The number is not a universal valuation metric: it depends on utilization, GPU generation, contract structure, electricity costs and the period used. Its purpose is to reveal whether newly activated power is producing more, less or roughly the same revenue as the existing fleet.
2. GAAP losses versus adjusted results
Why GAAP operating loss still matters
GAAP operating income incorporates depreciation and amortization on the company’s equipment and infrastructure, along with operating compensation and other expenses. CoreWeave’s Q2 2026 GAAP operating loss was $49 million. That result indicates that the full cost of operating and consuming the asset base exceeded recognized operating revenue for the quarter, even while the adjusted measures were positive.
PC Slower Than It Used to Be?
A free scan shows the junk files, broken settings and background clutter dragging Windows down - then fixes them in one click.Free scan · Windows 10 & 11Outdated Drivers Are Slowing You Down
One free scan finds every outdated or missing driver and matches the right update for your exact hardware.Free scan · exact hardware matchRead adjusted EBITDA with its bridge to GAAP
Adjusted EBITDA of $1.510 billion and a 59% margin can be useful for comparing periods, but the definition is company-specific. Build a bridge that identifies depreciation, stock-based compensation, restructuring or other specified adjustments, then ask whether those costs are recurring economic costs. Depreciation is especially important for a GPU-intensive operator because hardware must eventually be replaced.
Use adjusted operating income as an intermediate measure
CoreWeave reported adjusted operating income of $128 million, or a 5% margin, in Q2 2026. This figure is much closer to the GAAP operating result than EBITDA is. Track both margins each quarter:
| Measure | Q2 2026 amount | Margin | Interpretation |
|---|---|---|---|
| Adjusted EBITDA | $1.510 billion | 59% | Before depreciation, interest, taxes and specified adjustments. |
| Adjusted operating income | $128 million | 5% | Retains more operating costs and therefore gives a tighter profitability view. |
| GAAP operating income | $(49) million | Negative | Includes GAAP depreciation and other operating expenses. |
A widening gap between EBITDA and adjusted operating income can indicate rising depreciation, stock compensation or other adjustments. A narrowing gap would suggest that scale is absorbing those costs, although investors still need to account for interest and capital expenditure.
Rank #2
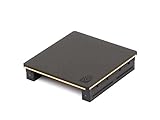
- Part number 900-53651-2500-000 and model: P3651
- This is the 2 slot version for when there is no empty slots between 2 slot cards. If you have one or more empty slots between the cards or the cards are 3 slot this NVLink will not work. See the attached images showing the card layout.
- NVLink 3.0 for any brand of RTX Ampere model graphics cards: 3090, A30, A40, A100 / H100 (Requires three NVLinks), A800, A4500, A5000, A5500, A6000
- This is the same as PNY part number: NVLAMP-2SLOT-BSP and RTXA6000NVLINK-KIT
- This is the same as Dell part number: 0RWJ7Y
3. Backlog: visibility, conversion and cancellation risk
What CoreWeave reported
Revenue backlog was approximately $104 billion at June 30, 2026. CoreWeave also said that more than $25 billion of net new commitments were added in early Q3. The backlog measure includes remaining performance obligations and estimated future revenue under committed contracts, subject to delivery and service availability.
The Tool Desk
Outbyte Driver Updater FREEScan for outdated or missing drivers - takes under a minuteDriver Scan →Outbyte PC Repair FREEClear out junk files and repair common Windows errorsFree Scan →Why backlog is not current revenue or cash
Backlog represents contracted visibility, not revenue already recognized and not guaranteed near-term cash flow. Revenue depends on CoreWeave delivering the required power, data-center space and GPU capacity, and on customers continuing to take service under their agreements. Commitments can be delayed, rephased, renegotiated or, in some circumstances, cancelled.
Calculate a practical conversion view
For each release, compare the change in backlog with the change in reported revenue:
- Record beginning backlog and ending backlog.
- Add new commitments disclosed during the period.
- Subtract the revenue recognized from the existing contracted base.
- Investigate the remainder for contract additions, cancellations, scope changes or timing effects.
- Compare the resulting conversion with power and facility delivery schedules.
Rapid backlog growth without corresponding deployment can mean demand is strong but execution is constrained. Revenue growth without backlog growth may indicate that the company is consuming its contracted base faster than it is replenishing it.
4. Power, GPUs, capex and depreciation: test whether capacity is productive
Active versus contracted power
At June 30, 2026, CoreWeave reported 1.5 GW of active power and approximately 3.7 GW of contracted power. Active power is capacity currently supporting operations; contracted power is a future supply commitment and still requires data-center delivery, equipment installation and customer deployment.
What’s actually slowing this PC down?
Pick the symptom - the matching free tool is one click away.
| Capacity measure | Reported level | Investor question |
|---|---|---|
| Active power | 1.5 GW | How much revenue and adjusted operating income is the operating fleet producing? |
| Contracted power | Approximately 3.7 GW | What is the schedule, cost and risk of converting contracted supply into usable capacity? |
| Difference between contracted and active power | Approximately 2.2 GW | How much future capacity remains subject to construction, interconnection, equipment and customer-take-up risk? |
Follow capital expenditure and depreciation together
Capital expenditure funds GPUs, servers, networking and facilities. Depreciation records the accounting consumption of those assets after they are placed in service. Compare capex with the growth in active power and revenue, then compare depreciation with revenue generated by recently deployed capacity. Heavy capex can be sensible during expansion, but returns deteriorate if equipment is installed before customers are ready or if hardware becomes obsolete faster than expected.
Rank #3
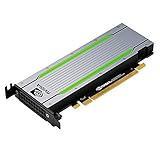
- Video/Sound Cards
- Passive Cooling
Watch hardware productivity and replacement cycles
GPU economics depend on utilization, rental rates, electricity and cooling costs, and the useful life of each generation. A warning sign is depreciation rising faster than revenue or adjusted operating income. Another is a falling revenue-per-active-power measure after large deployments. Those patterns can indicate underutilization, pricing pressure or an accelerated replacement cycle.
5. Debt, interest expense and liquidity
Interest is already a major operating constraint
Net interest expense was $640 million in Q2 2026. That amount exceeded the quarter’s $128 million adjusted operating income, so operating earnings did not cover financing costs on an adjusted basis. Track interest coverage using both GAAP operating income and adjusted operating income, and treat EBITDA-based coverage as a separate, less conservative view.
Monitor the financing stack and refinancing calendar
CoreWeave highlighted a $3.1 billion delayed-draw term loan and more than $10 billion of unsecured debt and convertible bonds raised in the quarter’s financial-position update. The relevant questions are:
- When can each facility be drawn, and what commitment or unused-line fees apply?
- What are the interest rates, maturities, covenants and collateral terms?
- How much debt must be refinanced before the assets generate stable cash returns?
- Could higher market rates materially increase future interest expense?
- How much covenant headroom remains if utilization or pricing weakens?
Debt-funded expansion can accelerate revenue, but it also makes timing errors expensive. A delay in power delivery can leave interest accruing before the associated capacity produces revenue.
Check liquidity and cash burn, not just the cash balance
Review cash and equivalents, restricted cash, available credit, operating cash flow, capex commitments and upcoming maturities together. A large cash balance may not be freely available if it is restricted or earmarked for construction. Conversely, a strong EBITDA number does not prove that cash remains after interest, taxes, working-capital movements and capex.
6. Cash-flow reality: the EBITDA-to-cash bridge
For the first six months of 2026, CoreWeave reported $4.653 billion of revenue, a $1.366 billion net loss, $1.176 billion of net interest expense, $2.540 billion of depreciation and amortization, and $2.667 billion of adjusted EBITDA at a 57% margin.
Rank #4

- CUDA Cores: 4608 / NVIDIA Tensor Cores: 576 / NVIDIA RT Cores: 72
- GPU Memory: 24 GB GDDR6 with ECC / Bandwidth: 624 GB/Sec
- System Interface: PCI Express 3.0 x16
- Four DisplayPort 1.4 Connectors
- 3D Stereo Support with Stereo Connector
| Six-month 2026 item | Reported amount | What to reconcile |
|---|---|---|
| Revenue | $4.653 billion | Compare with backlog consumed and new commitments. |
| Net loss | $(1.366) billion | Identify depreciation, interest and other below-operating-line costs. |
| Net interest expense | $1.176 billion | Compare with operating cash generation and debt growth. |
| Depreciation and amortization | $2.540 billion | Assess whether the asset base is producing enough revenue to justify replacement spending. |
| Adjusted EBITDA | $2.667 billion | Subtract cash interest, taxes, working-capital needs and capex to estimate cash available to equity. |
The key test is whether operating cash flow after interest can fund maintenance and expansion capex without repeated new borrowing or equity issuance. Track free cash flow over several quarters rather than relying on a single period affected by customer prepayments or construction timing.
Do these 3 things before closing this tab:
1Repair Windows errors before they cause bigger problems2Scan for outdated or missing drivers - takes under a minute3Clear out junk files and repair common Windows errorsA repeatable earnings-day monitoring process
- Update the income statement. Enter revenue, year-over-year growth, GAAP operating income, net income, diluted loss per share, adjusted EBITDA and adjusted operating income.
- Rebuild the reconciliation. Record each adjustment between GAAP and non-GAAP results and flag items that recur every quarter.
- Measure operating leverage. Compare adjusted EBITDA margin, adjusted operating margin and GAAP operating margin with the prior quarter and prior year.
- Refresh backlog. Note ending backlog, newly announced commitments, cancellations and any change in contract duration or customer concentration.
- Match capacity to revenue. Record active and contracted power, GPU deployments, new facilities and the revenue generated by capacity added in earlier periods.
- Check capital intensity. Compare capex, depreciation and amortization, and cash flow from operations; calculate whether new capacity is becoming productive.
- Review financing. Update debt balances, interest rates, maturities, draws, repayments, convertible dilution and covenant headroom.
- Read guidance and execution commentary. Compare management’s current outlook with the prior outlook and with actual results, especially for delivery dates and customer activation.
Customer concentration and execution risk
Backlog quality depends on who has committed it and whether those customers can take the contracted capacity. Monitor the share of revenue and backlog attributable to the largest customers, renewal and expansion behavior, payment terms and any cancellation or deferral disclosures. Concentration can make growth look secure while leaving the company exposed to one customer’s budget, product cycle or strategic decision.
CoreWeave identifies risks involving execution and growth management; maintaining and expanding the customer base; continued AI-infrastructure demand; disruption involving strategic relationships, suppliers or data-center partners; corporate infrastructure and internal controls; capital requirements and access to additional funding; and macroeconomic conditions such as inflation, tariffs, interest rates, geopolitical conflict and foreign-exchange movements.
Thesis-breakers to put on an investor checklist
- Backlog remains large but revenue conversion repeatedly slips.
- Power or data-center delivery falls behind the schedule implied by customer commitments.
- Customer concentration rises while cancellations, renegotiations or delayed take-up increase.
- Interest expense grows faster than operating cash generation.
- Refinancing becomes more expensive or unavailable before major maturities.
- Depreciation and replacement capex outpace the revenue productivity of deployed GPUs.
- Adjusted EBITDA stays strong while free cash flow remains negative after interest and capex.
- Management lowers guidance or changes deployment assumptions without a corresponding improvement in balance-sheet flexibility.
How to interpret management’s operating-leverage claim
Michael Intrator, CoreWeave’s co-founder, chairman and chief executive officer, said the company had reached an “important inflection point” as scale began translating into expanding operating leverage. That is management’s characterization, not an independently established conclusion. Test it against the reported figures: adjusted EBITDA margin was 59%, adjusted operating margin was 5%, GAAP operating income was negative $49 million, net interest expense was $640 million and the company continued to require substantial investment in power and equipment.
Operating leverage is becoming more credible when revenue grows faster than operating costs, adjusted operating margin expands, GAAP losses narrow, and incremental capacity produces cash after interest and maintenance capex. Until those conditions persist, treat the claim as a hypothesis to verify in subsequent filings.
Free tools Windows power users keep installed
One-click scans. No signup required.
What these metrics can—and cannot—tell you about the stock
This framework helps investors judge operating momentum, financial risk and execution. It does not by itself determine whether CoreWeave shares are cheap or expensive. A valuation decision also requires a current share price, diluted share count, market capitalization, enterprise value, expected cash flows and assumptions about future growth and financing. No independent analyst consensus, live share price, valuation multiple or third-party forecast is established here.
The most defensible conclusion from the reported data is balanced: CoreWeave is scaling revenue and contracted infrastructure at exceptional speed, while GAAP losses, interest expense, depreciation and capital requirements remain large. Investors should therefore monitor the conversion of backlog into productive capacity and cash flow, not simply the size of the backlog or the adjusted EBITDA margin.
Quick Recap
Product prices and availability are accurate as of the date/time indicated and are subject to change. Any price and availability information displayed on Amazon at the time of purchase will apply.

