
iTechGuides is reader-supported. When you buy through links on our site, we may earn an affiliate commission. As an Amazon Associate I earn from qualifying purchases. Learn more
Use both approaches, but give the final decision to laboratory chemistry combined with a representative microfermentation and structured sensory tasting. AI and electronic noses (e-noses) can rapidly infer smoke-treatment patterns from wine data, yet the best-known accuracy figures come from one controlled 2020 study. They do not prove that a sensor can directly detect odorless, bound smoke compounds on intact grape bunches or replace an accredited laboratory for harvest, contract, insurance, or release decisions.
For a commercial block, collect representative, variety-separated samples; ask the intended laboratory for the correct free- and bound-phenol panel; sample close to harvest; and make a small wine from the same fruit when the likely wine outcome matters. Interpret the chemistry with the winemaker, buyer, and insurer because no universal smoke-taint concentration or USDA Risk Management Agency threshold determines damage in every variety and region.
What each method measures
The phrase “AI detection” covers a very different measurement from a laboratory assay. An e-nose records a pattern from an array of chemical sensors. A trained model then maps that pattern to a treatment group, a measured marker concentration, or a sensory score. The sensor is not necessarily measuring guaiacol or a glycoside molecule directly. A laboratory, by contrast, separates and quantifies selected compounds with mass-spectrometry or related instrumentation. A microferment creates a small wine so that fermentation, extraction, and aroma perception are represented before a decision is made.
| Method | What it measures or infers | Best use | Important limitation |
|---|---|---|---|
| E-nose plus machine learning | Sensor-response patterns in wine, mapped by a model to treatment class, chemical-marker estimates, or sensory descriptors | Fast screening, process monitoring, and experimental decision support | Performance is model- and dataset-specific; it is indirect and has not been shown to measure bound compounds on intact bunches or replace a laboratory panel |
| Laboratory analysis | Selected free volatile phenols and, when ordered, bound or glycosylated smoke-related compounds | Objective evidence for lot segregation, winemaking, buyer discussions, and some documentation or claims | Panel choice, sampling time, natural variety baselines, laboratory capacity, and interpretation affect the result; chemistry alone may not predict sensory impact |
| Microfermentation plus sensory evaluation | A small wine made from representative grapes, then judged for aroma and flavor and optionally analyzed chemically | Estimating the wine outcome that a lot could produce | Requires time and disciplined handling; tasters vary in sensitivity, and a small-scale wine may differ from commercial production |
A useful way to think about the comparison is speed versus decision relevance. An e-nose may sort many samples quickly if its model was trained for the same varieties, smoke conditions, and target measurements. A lab gives chemical evidence but still cannot, by itself, guarantee how a finished wine will smell. A microferment is slower, yet it exposes the compounds to the same broad transformations that make smoke taint perceptible in wine.
#1 Best Overall

- 【Precision Accuracy Hydrometer】This triple scale hydrometer kit can test it once to get ABV, Brix and Gravity. It will help you elevate your brew as you'll be able to easily and accurately measure your alcohol percentage until you get it to your liking.
- 【Triple Scale Beer Hydrometer】Brewing hydrometer that reads Brix Balling (0-35), Specific Gravity (0.99-1.17), and Potential Alcohol (0%-20%). This essential proofer is easy to read and free of mercury. It gives you an estimated prediction of what alcohol content you will have in your final product. The CIMALAB hydrometer comes with instructions and 11.8"storage tube.
- 【Easy to Read & Accurate】Knowing exactly of your final gravity reading with this extra large lines and larger font numerals. Graduated color bands making it easier to identify so you can be more precise in your readings. Eliminate guesswork and make home brewing easier!
- 【Designed for Brewing】This wine making supplies is the ideal kit for homebrewers of all experience levels. It comes with everything you need to get easy and accurate readings: triple scale hydrometer, plastic test jar, cleaning brush, detailed instructions, and more. Use it to make lagers, ales, wines, and cider, the rest is up to you!
- 【 What You will Get】1*triple scale hydrometer, 1* clear hydrometer test tube, 1* bottle brush, 1* microfiber cleaning cloth, instruction sheet with conversion chart, an exquisite packing and our worry-free 12-month warranty with friendly customer service! (Great choice to wrap as a gift for brewers!)
What the strongest AI and e-nose evidence shows
The 2020 controlled-vine study
A paper in Sensors (2020) exposed vines to low- and high-density smoke, included controls and a misting treatment, and used a low-cost e-nose on wines from five treatment groups. Across 300 samples, its classification model reported 97% accuracy in assigning the research treatments. That number describes the specified dataset and model, not a guaranteed accuracy rate for an arbitrary commercial vineyard.
| Target predicted from e-nose data | Reported fit | How to read it |
|---|---|---|
| Berries one hour after smoke | R = 0.98; R² = 0.95; slope b = 0.97 | Agreement with the study’s measured target under its test conditions |
| Berries at harvest | R = 0.99; R² = 0.97; slope b = 0.96 | Strong in-sample model fit, not independent validation across vineyards |
| Wines | R = 0.99; R² = 0.98; slope b = 0.98 | High correlation for the wines and targets used in that experiment |
| Consumer sensory model using 12 descriptors | R = 0.98; R² = 0.96; slope b = 0.97 | Model fit to the study’s sensory data, not a universal human-perception test |
Correlation and classification results are not the same as an external validation. A model can perform extremely well when training and test samples share the same varieties, smoke recipe, sensor hardware, and laboratory targets. Accuracy can fall when a commercial block has a different cultivar, canopy, smoke age, background odor, fermentation regime, or sensor calibration. No cited study establishes one model as validated across commercial varieties, regions, seasons, smoke types, and hardware.
Why an e-nose cannot simply sniff a grape bunch
Smoke-derived volatile phenols can be metabolized in grapes into glycosylated compounds. These bound forms are generally odorless until processing or chemical hydrolysis releases material that can contribute to aroma. The 2020 paper states that its models could infer contaminant levels from e-nose readings but could not directly “sniff” those contaminants from bunches. In practice, an e-nose reading is a pattern-based proxy whose usefulness depends on the material placed in front of the sensors, often juice or wine, and on the model’s training targets.
Do these 3 things before closing this tab:
1Fix the driver behind crashes, sound loss and screen glitches2Clear out junk files and repair common Windows errors3Scan for outdated or missing drivers - takes under a minuteThat boundary matters when a grower asks whether fruit can be harvested today. A sensor reading from a finished or partially fermented sample may support triage, but it does not establish the amount of bound material in every cluster. It also does not create a legally recognized damage threshold.
Where sensor development stands
USDA Agricultural Research Service project 2032-30500-001-010-S runs from September 1, 2022, through August 31, 2027, to identify additional smoke-taint compounds and explore potential in-process sensors. Wine Australia project WA Ph2200 ran from January 2023 through January 2026 to develop rapid analytical methods; its project page describes preliminary trials as unpublished. These dates show active development, not a currently validated commercial AI product that supersedes laboratory testing.
What laboratory testing can tell you
Free and bound phenols
Oregon State University’s analytical chemistry service lists free-phenol analysis for guaiacol, 4-methylguaiacol, and the ortho-, para-, and meta-cresols. Its bound-phenol service uses acid hydrolysis to estimate total smoke phenols, which can reveal material that is not present as a freely volatile compound in the original sample. The listed instruments include LC-MS/MS, LC-QToF, GC-MS/MS, and GC-QToF.
Rank #2
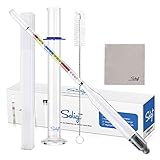
- Complete Set for Home Brewer- Package includes 1*triple scale hydrometer, 1*clear glass cylinder test jar, 1* bottle brush made of stainless steel, 1*sturdy storage case to protect hydrometer from breakage, 1* instruction sheet with conversion chart and 1*microfiber cleaning cloth.
- Accurate & easy to read- Get the perfect measuring result with our high quality hydrometer which comes with detailed markings on specific gravity from 0.99-1.17, brix /balling from 0-35 and potential alcohol by volume from 0%-20% and our glass test tube which you can easily read - for nearly all of your spirit-making needs!
- Save precious liquid- You only need 125ml rather than 250ml beer or wine for testing. Our jar is with narrow opening plus tall enough to help you get the best readings. Waste less, drink (or share) more!
- Perfect packaging- All of our home brewing supplies and equipment are packed in heart designed package box and is drop tested to minimize breakage, which makes it a perfect gift for your friends, family and colleagues.
Those measurements answer a chemical question: which compounds, or estimated totals after hydrolysis, are present at the time of testing. They do not automatically answer a sensory question. OSU notes that some smoke-related phenols and glycosylated markers can occur naturally in grapes. Without variety-specific baseline data, a positive result is not necessarily perceptible taint, and no single concentration should be treated as a universal “tainted” or “clean” cutoff.
What’s actually slowing this PC down?
Pick the symptom - the matching free tool is one click away.
What a broader biomarker panel adds
A 2024 peer-reviewed biomarker study used LC-MS on samples from multiple grape varieties, sites, and exposure levels. It reported 73 differentially expressed metabolites and structural assignments for 15 compounds, including guaiacol and syringol derivatives and newly described glycosylated intermediaries. The result shows that smoke exposure chemistry is broader than a one-marker test. It does not mean every identified metabolite has been validated as a routine diagnostic or has a known sensory threshold.
Example laboratory requirements and fees
When accessed on October 9, 2026, OSU listed $225 per sample for free-phenol analysis and $270 per sample for bound-phenol analysis, with lower per-sample rates for larger batches. The same service page specified at least 50 mL of wine per variety or five to six frozen grape clusters per variety for its listed preparation. Fees, sample rules, turnaround, and harvest capacity can change, so confirm them directly before collecting fruit. A different laboratory may require juice, must, a microferment, different preservation, or a different volume.
Do not compare a quoted price without checking what the panel includes. A free-phenol-only result and a combined free-plus-bound panel answer different questions. Ask whether the laboratory’s accreditation covers the requested analysis if the result may be used for an insurance claim or contractual dispute.
Why a grape result may not predict the finished wine
Fermentation changes extraction, binding, volatility, and the balance of aroma compounds. Some bound precursors can release odor-active phenols during processing or later in the bottle, while other compounds may be diluted or masked by normal wine aromas. For that reason, OSU Extension states: “A lab analysis of smoke-exposed grapes can reveal useful information, but often such analysis alone is insufficient to reliably predict the risk of smoke-affected wines.”
A microferment uses a representative portion of the crop to make a small wine before a release or harvest decision. The resulting wine can undergo the same broad conversion from grape precursors to wine aroma compounds, although the scale, yeast, skin contact, and vessel will not exactly match commercial production. Pairing its sensory result with post-fermentation chemical analysis gives a stronger basis than either a grape test or a tasting alone.
Rank #3

- Acid testing kit for wine
- Easy to Use
- Includes standard sodium hydroxide solution, acid indicator solution, calibrated syringe, test tube and instructions
- Sufficient for 50 to 100 tests
Step-by-step assessment workflow
1. Contact the intended laboratory before sampling
- Ask whether it accepts intact grapes, juice, must, microfermented wine, finished wine, or all of these.
- Ask which free-phenol and bound-phenol panel fits the decision you need to make.
- Confirm minimum volume or cluster count, freezing or shipping requirements, containers, labeling, chain-of-custody rules, turnaround, current fees, and accreditation.
- Ask whether the laboratory can handle harvest-season volume and whether an expedited service is available.
Laboratory protocols differ. A sample collected correctly for one provider can be unsuitable for another, so obtain written instructions first.
2. Build a representative, variety-separated sample
Walk the relevant vineyard area and collect clusters throughout the block rather than choosing only the most visibly smoky or healthiest fruit. Keep varieties separate because cultivars can respond differently under similar exposure. If smoke intensity, elevation, row orientation, irrigation, or canopy management varies materially, discuss separate lots with the winemaker and laboratory.
Follow any crop-insurance collection rules and preserve chain of custody when a claim or buyer dispute is possible. Record block, variety, clone if relevant, row or zone, collection date and time, smoke event dates, irrigation or washing treatments, and the person who handled each sample.
Free tools Windows power users keep installed
One-click scans. No signup required.
3. Sample close to harvest
OSU’s microfermentation guidance recommends sampling as close to harvest as feasible because an early result may need follow-up. It gives more than 22 °Brix as a general guide, while noting that some varieties are picked at lower Brix. Use the maturity target appropriate for the variety and winery rather than delaying harvest solely to reach a generic number.
If an early sample is unavoidable, label it as an interim result and plan a second sample near the expected pick date. Keep the same block and variety definition so the results can be compared rather than mixing changing populations.
4. Make a microferment when wine outcome is the decision
OSU describes collecting at least 40–50 clusters across the block and using a food-grade or stainless vessel for destemmed berries. A five-gallon food-grade fermentation bucket is simply a container for this procedure; it does not detect smoke compounds. Follow the laboratory’s detailed protocol for crushing, inoculation, temperature, skin contact, pressing, stabilization, and sample submission.
Rank #4

- Tailored for Wine-Making: The hBARSCI pH Test Strips are ideal for home winemakers, measuring the precise 2.8 to 4.4 pH range essential for perfect wine acidity. Use these wine pH test strips to ensure every batch hits the right note
- Generous 100 Strip Supply: With 100 pH strips per vial, this kit is perfect for repeated batch testing, minimizing the need for constant restocking. Enjoy the convenience of frequent testing without interruption, keeping your wine-making process smooth
- Easy pH Assessment: Simply place a drop of wine on the pH paper and match the color to the chart for an accurate acidity reading. These pH testing strips provide a straightforward method for home winemakers looking to craft the finest wines
- Durable Design: Crafted with durable paper, these multicolor strips are built to withstand repeated use in any home brewing setup. The water-resistant color chart ensures reliable pH readings across repeated tests
- Perfect for Enthusiasts: Whether you're testing wine or water, these versatile strips are a must-have for any science enthusiast. They make an excellent gift for wine lovers and home brewers who appreciate precision and quality in their tools
Use fruit that represents the lot you may actually sell or process. If the block contains distinct varieties or exposure zones, make separate microferments instead of blending them and losing the signal. Submit the finished microferment for the agreed chemical panel when the laboratory advises that this will improve interpretation.
Quick wins for a faster PC:
Clear out junk files and repair common Windows errorsFree Scan →Fix the driver behind crashes, sound loss and screen glitchesFind Drivers →5. Run a controlled sensory evaluation
- Use several tasters when possible; individual smoke sensitivity differs.
- Screen tasters with known impacted and unaffected reference wines before judging unknowns.
- Code samples blind and randomize serving order so expectations do not reveal the treatment.
- Taste each sample at least twice, on separate passes or sessions.
- Allow at least two minutes between samples to reduce aroma and flavor carryover.
- Record specific descriptors, intensity, aftertaste, and whether the character is acceptable for the intended style.
OSU cautions that many people are not sensitive to smoke taint. A panel that reports no taint is therefore not proof that every consumer or buyer will perceive none. Keep the tasting sheet with the chemical report and identify the tasters and protocol.
6. Interpret the package with the decision-makers
Review the laboratory report, microferment chemistry, sensory notes, and vineyard records with the winemaker, buyer, and insurer. The USDA Risk Management Agency has not established a specific smoke-compound threshold for determining smoke damage. OSU guidance discusses values that some laboratories consider elevated and notes that compounds can occur naturally; those values are not universal sensory cutoffs.
Ask the buyer or contract administrator what evidence is required for acceptance, segregation, price adjustment, or rejection. For an insurance claim, confirm the insurer’s sampling, timing, chain-of-custody, and documentation requirements before discarding or blending fruit.
Independent reader supportYour contribution helps us test, update, and keep practical guides available for everyone.Which method fits which decision?
| Decision | Most useful evidence | Why | What it cannot establish alone |
|---|---|---|---|
| Rapidly rank many lots for follow-up | E-nose screening calibrated to the same material and conditions, followed by selected lab tests | Fast pattern recognition can prioritize samples | A commercial damage threshold or the absence of bound precursors |
| Document chemical exposure | Laboratory free- and bound-phenol panel with documented sampling | Provides traceable measurements of selected markers | Guaranteed finished-wine aroma or consumer acceptance |
| Decide whether to harvest, segregate, or vinify | Representative microferment plus sensory evaluation and chemical analysis | Approximates fermentation and captures perceptual impact | Exact performance of the full-scale winery process |
| Support a buyer or insurance discussion | Chain-of-custody samples, laboratory report, microferment results, sensory records, and contract-specific criteria | Combines objective, process-relevant, and documented evidence | Automatic approval if the contract or insurer uses different rules |
Common mistakes and how to correct them
Treating 97% as a product guarantee
The 97% figure belongs to five controlled treatment groups and 300 samples in one 2020 study. Do not advertise or assume that an e-nose will classify every vineyard with 97% accuracy. Request validation data for your varieties, sample type, smoke profile, and sensor hardware; if it is unavailable, treat the result as screening evidence.
Testing only free guaiacol
Free guaiacol and 4-methylguaiacol are important markers, but bound compounds and other phenols can matter after fermentation. Ask whether the panel includes bound or glycosylated analysis and document why that panel was selected.
Best Value

- Test to control and monitor Malic Acid and completion of Malolactic Fermentation in wines
- Quantitatively measures from from 0 - 500 mg/L
- Every kit comes with ten strips and ten samplers and requires no extra chemicals or instrumentation for accurate readings
- Accuvin strips have a unique construction enabling the removal of pigments from red wines making them usable on any wine
- No sample prep required, enabling you to get actionable results in a matter of minutes!
Sampling one convenient cluster
Smoke exposure and grape composition vary within a block. A single cluster can misrepresent the lot and is especially weak evidence for a claim. Sample across the area, separate varieties, and retain enough material for repeat or confirmatory testing.
Relying on an early-season negative
Grape chemistry and maturity change. An early sample may not represent the fruit at harvest, so arrange a near-harvest follow-up when the first test was taken well ahead of picking.
Letting one taster decide
Sensitivity varies, and fatigue or carryover can mask aromas. Use multiple screened tasters, blind coding, repeat tasting, and two-minute intervals. Preserve the raw notes rather than recording only a yes-or-no verdict.
Recommended Free Tools
Assuming washing removes the risk
Surface cleaning or a misting treatment does not demonstrate that internal or bound compounds have disappeared. Evaluate the treated lot with the same representative sampling, laboratory, microferment, and sensory procedure as an untreated lot.
Ignoring documentation
Record dates, locations, varieties, maturity, smoke conditions, treatment history, sample handling, laboratory instructions, model version if an AI tool is used, and every sensory participant. Consistent records make repeat testing interpretable and help distinguish a lot change from a measurement change.
How to use AI responsibly in a winery workflow
An e-nose can be useful as a triage layer when it is calibrated and monitored like any other instrument. Keep a reference set of unaffected and known impacted wines, check sensor drift, and periodically compare predictions with laboratory results. Flag samples outside the model’s training range instead of forcing a classification. Store the raw sensor pattern and the model version with the result so a later prediction can be reproduced.
Do not let an AI score override a contradictory laboratory or microferment result without investigating sample identity, contamination, calibration, and model applicability. A practical escalation rule is to send borderline, high-value, disputed, or contract-critical lots to laboratory analysis and a structured microferment even when the rapid screen looks favorable.
The Tool Desk
Outbyte Driver Updater FREEFix the driver behind crashes, sound loss and screen glitchesFind Drivers →Outbyte PC Repair FREEClear out junk files and repair common Windows errorsFree Scan →Bottom line for growers and winemakers
AI and e-nose systems are promising rapid inference tools, not proven stand-alone detectors for smoke taint in intact grape bunches. Laboratory analysis supplies chemical evidence; microfermentation and disciplined sensory evaluation show whether that chemistry is likely to matter in wine. The defensible decision package is representative, variety-separated sampling near harvest, an appropriate free-plus-bound laboratory panel, a microferment when wine outcome matters, and documentation reviewed against the actual buyer or insurance criteria.
Quick Recap
Product prices and availability are accurate as of the date/time indicated and are subject to change. Any price and availability information displayed on Amazon at the time of purchase will apply.

