
iTechGuides is reader-supported. When you buy through links on our site, we may earn an affiliate commission. As an Amazon Associate I earn from qualifying purchases. Learn more
AI forecasts can help integrate wind and solar when their estimates—and uncertainty—are passed into the power-system models used to make operational and planning decisions. A forecast does not show whether the grid can carry the resulting power or remain stable; network, operational, and economic models evaluate those consequences.
What the forecast contributes—and what it cannot answer
A renewable-generation forecast estimates output over a future period from inputs such as weather, recent generation, and plant characteristics. An AI or machine-learning method may help find patterns in those inputs, but the resulting forecast is still an estimate. It is not a network model and does not, by itself, establish that a dispatch is feasible, that reserves are sufficient, or that a disturbance can be managed.
To assess those questions, planners and operators connect forecast output to a representation of the power system: generators, loads, transmission or distribution equipment, operating constraints, and, where relevant, controls and protection. The model tests the implications of forecast scenarios. This distinction matters because better forecast accuracy alone does not guarantee reliable integration or lower costs.
Free tools Windows power users keep installed
One-click scans. No signup required.
A concrete example is NREL’s A2e2g research platform, which links weather-uncertainty forecasts with wind-plant aerodynamic and economic models to study plant operations and energy or grid-service value. It illustrates model coupling for a defined research purpose; it is not evidence that one platform implements every step of a utility’s operational or planning workflow. NREL Research Hub: A2e2g
#1 Best Overall

- COMPLETE WEATHER STATION: (1) Osprey Sensor Array with Rain Cup, and (1) Brilliant, Easy-to-Read LCD Color Display
- AUTHENTIC HYPER-LOCAL DATA: Monitor your actual home and backyard weather conditions with our wireless and Wi-Fi-enabled sensor array measuring wind speed/direction, temperature, humidity, rainfall, UV intensity, and solar radiation
- SMART HOME READY: Set up alerts, access your data remotely, and program your home based on weather conditions using IFTT, Google Home, Alexa, and more
- ENHANCED WIFI: Enables your station to transmit its data wirelessly to the world's largest personal weather station network (optional setting)
- JOIN THE COMMUNITY: Connect to Ambient Weather Network to customize your dashboard tiles, share hyperlocal weather conditions via social feeds and create your own forecasts (coming soon)
Choose the model to match the decision
The right combination depends on what someone must decide, how soon, and at what level of the grid. A detailed transient simulation is not automatically better than a time-series power flow: it may answer the wrong question at much greater computational cost. DOE’s 2024 Grid Modernization Strategy identifies several distinct modeling needs, from power flow and production cost to dynamic response and transient stability, alongside improved forecasting and data-model convergence. U.S. Department of Energy, Grid Modernization Strategy 2024
| Decision or question | Modeling approach to consider | What the forecast contributes |
|---|---|---|
| Will expected flows create a constraint or overload? | Power-flow analysis, potentially across a range of operating conditions | Renewable and load scenarios for the period under study |
| How should resources be scheduled, and what are the operating or production-cost consequences? | Production-cost or economic-dispatch modeling | Forecast scenarios that inform available variable generation and its uncertainty |
| Are reserves or operating plans adequate across plausible forecast errors? | Operational or reliability analysis that represents reserve and system constraints | Forecast distributions or scenarios, rather than only one expected value |
| What happens after a disturbance, and how do resources respond? | Dynamic-response or transient-stability studies | Operating conditions and resource availability used to define study cases |
| How do distribution conditions interact with the transmission system? | Integrated transmission-distribution analysis | Geographically and temporally appropriate distributed-generation and load scenarios |
| Which future grid investments or resource portfolios are useful? | Capacity-expansion and transmission-planning models, with operational analysis where needed | Longer-term resource and weather scenarios, not just a near-term point forecast |
These categories are not interchangeable. A steady-state power-flow result does not establish dynamic stability, while a stability study does not by itself establish the least-cost schedule or investment plan. NREL’s transmission-planning resources describe the range of planning analyses, and its modeling-tools page lists examples including flexible energy scheduling for variable generation, a high-renewable test-case repository, MAFRIT for frequency response, and IGMS for integrated transmission-distribution analysis. NREL: Transmission Planning · NREL: Grid Modeling Tools
Connect forecast and grid models in a decision-focused workflow
- Name the decision. Specify whether the study supports reserve scheduling, congestion assessment, interconnection, capacity expansion, or stability analysis. Define who will use the result and what action it can inform.
- Set the time and geography. Choose a forecast horizon and time step that suit the decision, then define the grid area and level of detail. A system-wide planning scenario and a feeder-level interconnection assessment need different spatial representations.
- Build and check the system representation. Validate relevant network topology, equipment limits, generation, loads, controls, and operating assumptions against appropriate system data. For distribution studies, include distributed energy resources where they could materially affect the result.
- Prepare forecast inputs with uncertainty intact. Align forecast timestamps and geographic locations with model inputs. Preserve plausible ranges or scenarios for renewable output and relevant weather or load conditions; do not reduce uncertainty to a single expected value if the decision depends on adverse or tail outcomes.
- Run the model suited to the question. Apply forecast scenarios to the appropriate power-system or economic analysis. Use a different or additional model when the decision requires a different kind of evidence—for example, dynamic response rather than steady-state flows.
- Compare consequences and communicate limits. Examine how scenarios affect the decision-relevant outputs, such as constraints, operating requirements, or candidate investments. Document assumptions, input quality, model boundaries, and which conditions were not represented.
This workflow synthesizes capabilities and needs described by NREL and DOE; it should not be read as a claim that any one tool listed here performs the whole chain. DOE’s strategy specifically identifies the need to connect forecasting and data science with models used for robust operational planning. It says: “To truly benefit from the increased volume and diversity of data, we need improved Data Science and Forecasting techniques in the areas of statistics-based models, data reduction techniques, artificial intelligence and machine learning approaches, and data-model convergence to support robust operational planning to ensure resource adequacy and mitigate power system disruptions.” U.S. Department of Energy, Grid Modernization Strategy 2024
Rank #2

- [Color LCD Screen Weather Station] Newentor temperature & humidity monitor with a large color LCD display shows essential home weather information at a glance: indoor/outdoor temperature & humidity, daily high/low records, customizable alerts, time/date, alarm clock & snooze, weather forecast, moon phase, and barometric pressure.
- [Two Power Modes & Adjustable Backlight] To enjoy a 24/7 continuous always-on vibrant display, simply connect this home weather station to a wall outlet using the included DC power adapter. When operating on battery power only (batteries not included), the digital thermometer automatically enters an eco-energy-saving mode, where the screen lights up for a quick 15-second glance before dimming. It is the perfect bedside or living room clock designed to fit your power preference.
- [3-channel Home Weather Stations Wireless Indoor Outdoor] Wireless temperature forecast station supports up to 3 remote sensors to monitor inside outside temperature & humidity of multiple locations. Package contains one remote sensor.
- [Wireless Forecast Station] The weather forecast station calculates the weather forecast for the next 12-24 hours, 7 to 10 days calibration ensures an accurate personal forecast for your location.
- [Wireless Weather Station with Atomic Time&Date] Atomic alarm clock weather station can be used not only as a wireless indoor outdoor thermometer but also as an atomic clock with dual alarms.
Make uncertainty and validation part of the analysis
A forecast’s usefulness depends on more than its average error. A planner or operator needs to know whether it performs adequately for the locations, horizons, and conditions relevant to the decision—and how forecast errors could change the model’s result. Where possible, validate forecasts on data not used to fit them, examine performance across relevant periods and weather conditions, and carry realistic error scenarios into the system analysis.
- Check alignment: confirm that forecast locations, time intervals, units, and technology definitions match the grid model’s inputs.
- Test more than typical conditions: include plausible forecast deviations and relevant weather or load contexts, particularly when the decision is sensitive to low generation or constrained conditions.
- Keep the validation question specific: report the validation data and conditions, forecast horizon, and out-of-sample performance relevant to the intended use. Do not infer operational value solely from a general accuracy score.
- Check whether results are actionable: a modeled constraint or operating need is useful only if it is visible to the relevant planner or operator and connected to a feasible decision or control.
NREL describes transmission planning across different study scales, while NLR’s distribution-system work spans electromagnetic-transient studies, time-series power flow, and annual simulation for planning and forecasting. It also describes machine-learning screening of residential PV interconnection applications—a distinct use case from forecasting system-wide renewable output. NLR: Distribution System Planning, Analysis, and Grid Integration
Represent distributed resources at the level the study needs
As rooftop solar, storage, and other distributed energy resources become relevant to a study, an aggregate or simplified representation may omit behavior that affects local flows, visibility, or system response. The appropriate level of detail depends on the question: not every planning case needs an individual model of every device, but the assumptions about aggregation and controls should be explicit.
Rank #3
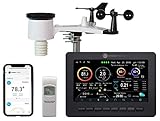
- Allows you to monitor your home and backyard weather conditions with TFT color display
- Wireless all-in-one integrated sensor array measures wind speed/direction, temperature, humidity, rainfall, UV and solar radiation
- Supports both imperial and metric units of measure with calibration available
- Enhanced Wi-Fi connectability option that enables your station to transmit its data wirelessly to the world's largest personal weather station network
- Console power provided by 5V DC adapter (included), and sensor array requires 3 x AAA batteries (not included)
NERC-related guidance summarized by NREL discusses distributed-resource connection modeling and reliability considerations. That underlying report was published in 2017 and predates IEEE 1547-2018, so it is historical context, not a current compliance checklist. Check applicable current standards and requirements before making compliance decisions. NREL summary: DER connection modeling and reliability considerations
Recommended Free Tools
Use public tools and datasets as components, not a turnkey AI system
Public resources can support exploration and particular parts of the workflow, but their presence on a resource list does not mean they form one integrated forecasting-and-grid-modeling product. Select a tool or dataset for its actual function, geography, input requirements, and intended use; check its current documentation and availability before relying on it.
| Resource | Role in a study |
|---|---|
| NREL grid-modeling resources | Examples include a flexible energy scheduling tool, high-renewable test cases, MAFRIT for frequency response, and IGMS for integrated transmission-distribution analysis. |
| NLR utility and grid-operator resources | A directory naming distinct software and data resources, including DISCO, PVWatts, reV, the Wind Resource Database, and NSRDB. |
| NLR distribution-system analysis | Describes analytical approaches spanning electromagnetic transients, time-series power flow, and annual simulation, as well as machine-learning screening for PV interconnection applications. |
| NREL A2e2g | A research platform example connecting weather forecasts, wind-plant operation models, and economic analysis. |
DOE’s renewable-systems integration work also frames integration as a system-level challenge rather than a forecasting-only task. DOE: Renewable Systems Integration
Rank #4

- Illuminated Indoor Outdoor Weather Station for Home with Large Colorful Display: The home weather station delivers large big numbers for weather forecast info, indoor outdoor temperature, atomic time, date, year and calendar day, which is super easy to read from afar.
- Indoor outdoor Thermometer Wireless with High/Low Temperature Alert: The digital weather station supports 3 outdoor sensors which helps to monitor temperature and humidity of multiple locations (one sensor included). With the high/low temperature alert function, the weather station clock keeps you informed about the changes of weather thermometer outdoor.
- WWVB Atomic Weather Station with Auto DST: Weather atomic clock with indoor/outdoor temp always keeps precise time and date by receiving the WWVB atomic signal. The self setting digital weather clock will automatically adjust to daylight saving time with auto DST feature, no more resetting twice a year.
- Personal Weather Forecast Station: This weather stations wireless indoor outdoor predicts the next 12-24 hours weather condition with a 7-day calibration through the pressure of your location which provides you a better outing experience.
- 5 Level Adjustable Backlight Brightness: The weather clock indoor outdoor temperature atomic with backlight dimmer function helps you avoid high-intensity light that disturb your sleep and easily check the weather situation during the day.
How to judge a proposed forecast-model combination
There is no universally best AI method established by the sources cited here. Evaluate a proposed combination against the decision it must support, rather than treating model sophistication or a single accuracy metric as proof of value.
- Does its forecast horizon and time resolution match the decision?
- Does it cover the relevant locations, network level, renewable technologies, and distributed resources?
- Does it represent forecast uncertainty in a form the system model can use?
- Is the grid model’s fidelity—steady-state, dynamic, or transient—appropriate to the question?
- Are forecast validation data and out-of-sample performance relevant to the intended geography and conditions?
- Can the forecast and system model exchange inputs and outputs reproducibly, at a computational cost suited to the use?
- Can the resulting information support an actionable planner or operator decision?
For wider planning context, NREL’s resources on reliable operations address the relationship between planning and operational reliability. NREL: Planning for Reliable Operations
Crashes, No Sound, or Screen Glitches?
Random freezes, missing sound and display glitches usually trace back to one bad driver. Find and replace yours safely.Free scan · under a minutePC Slower Than It Used to Be?
A free scan shows the junk files, broken settings and background clutter dragging Windows down - then fixes them in one click.Free scan · Windows 10 & 11Quick Recap
Product prices and availability are accurate as of the date/time indicated and are subject to change. Any price and availability information displayed on Amazon at the time of purchase will apply.

