This Itechguide teaches you how to open the Windows 10 crash log to determine the reason for OS crashes. The guide offers 3 steps to open and read Windows 10 crash dump files
Step 1: Install the Debugging Tools For Windows
The “Debugging Tools for Windows” is part of Windows 10 SDK. You require the debugging tool to open the Windows 10 crash log file.
Follow the steps below to download Windows 10 SDK and install “Debugging Tools for Windows”:
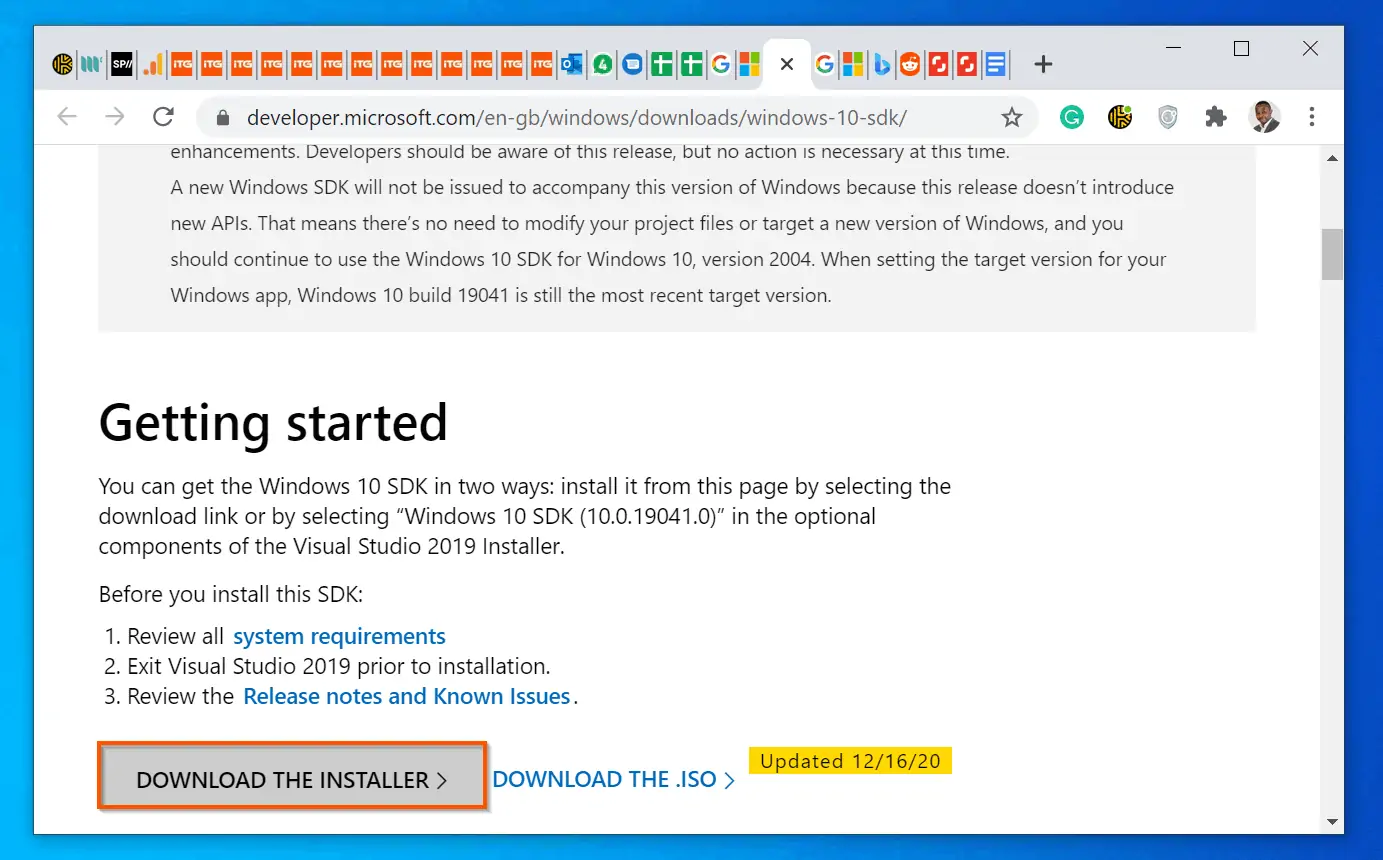
- Open Windows 10 SDK download site.
- Then, scroll down to the “Getting started” section of the page and click DOWNLOAD THE INSTALLER – an MSI installation file will be downloaded.
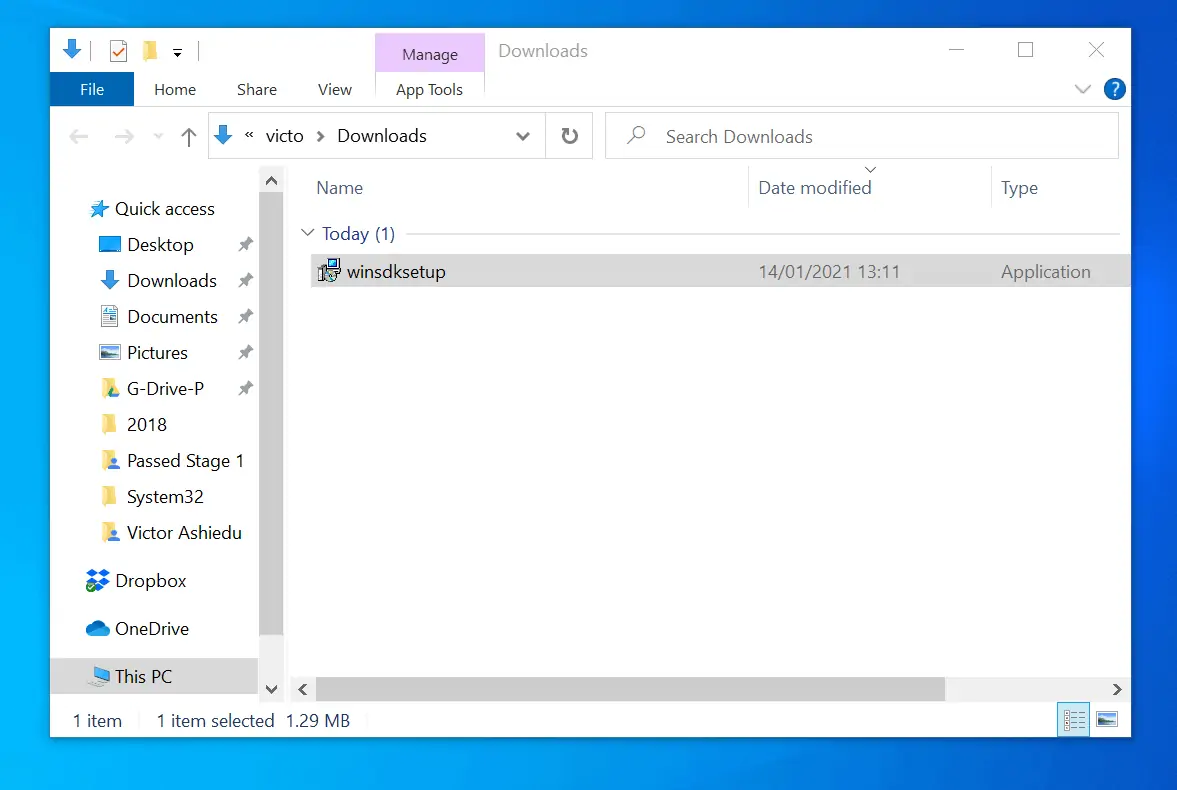
- Open the location you saved the MSI file and double-click to open it.
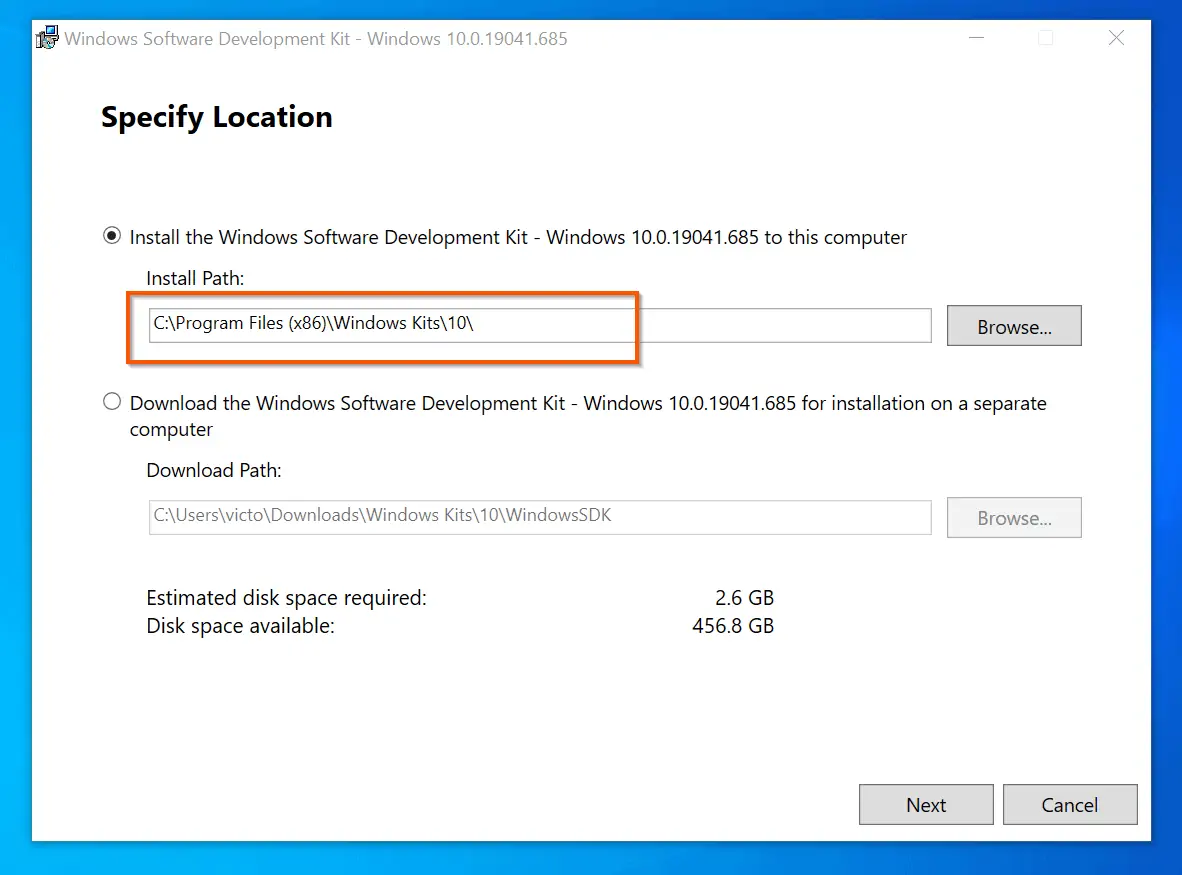
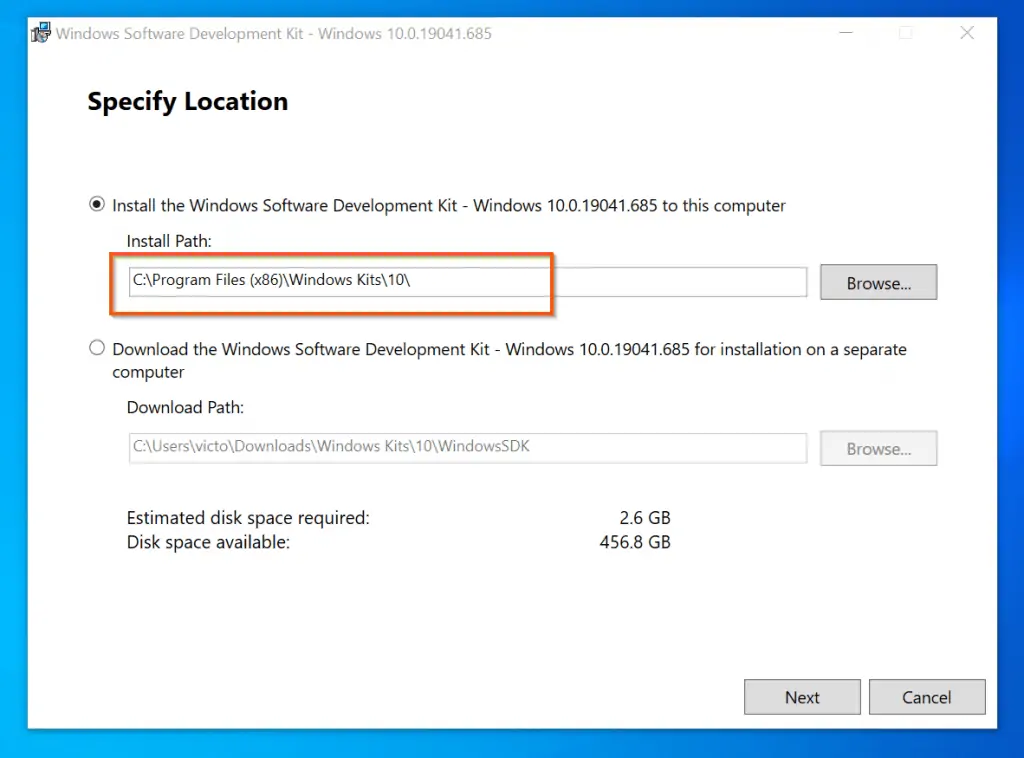
- Furthermore, on the “Specify Location” screen, note the path Windows SDK will be installed. Then, on the bottom right of the screen, click Next.
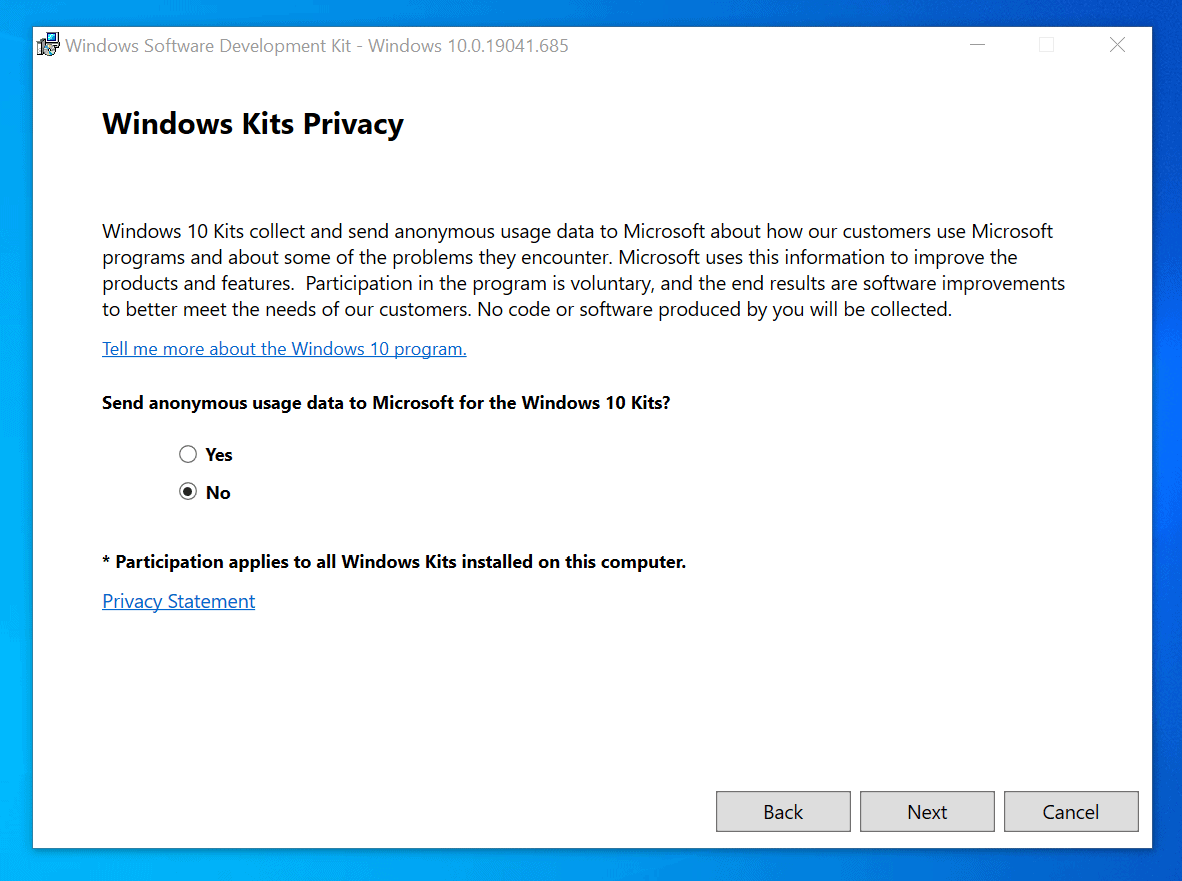
- On the Windows Kits Privacy screen, select an option – default is “Yes”. Then, at the bottom right, click Next.
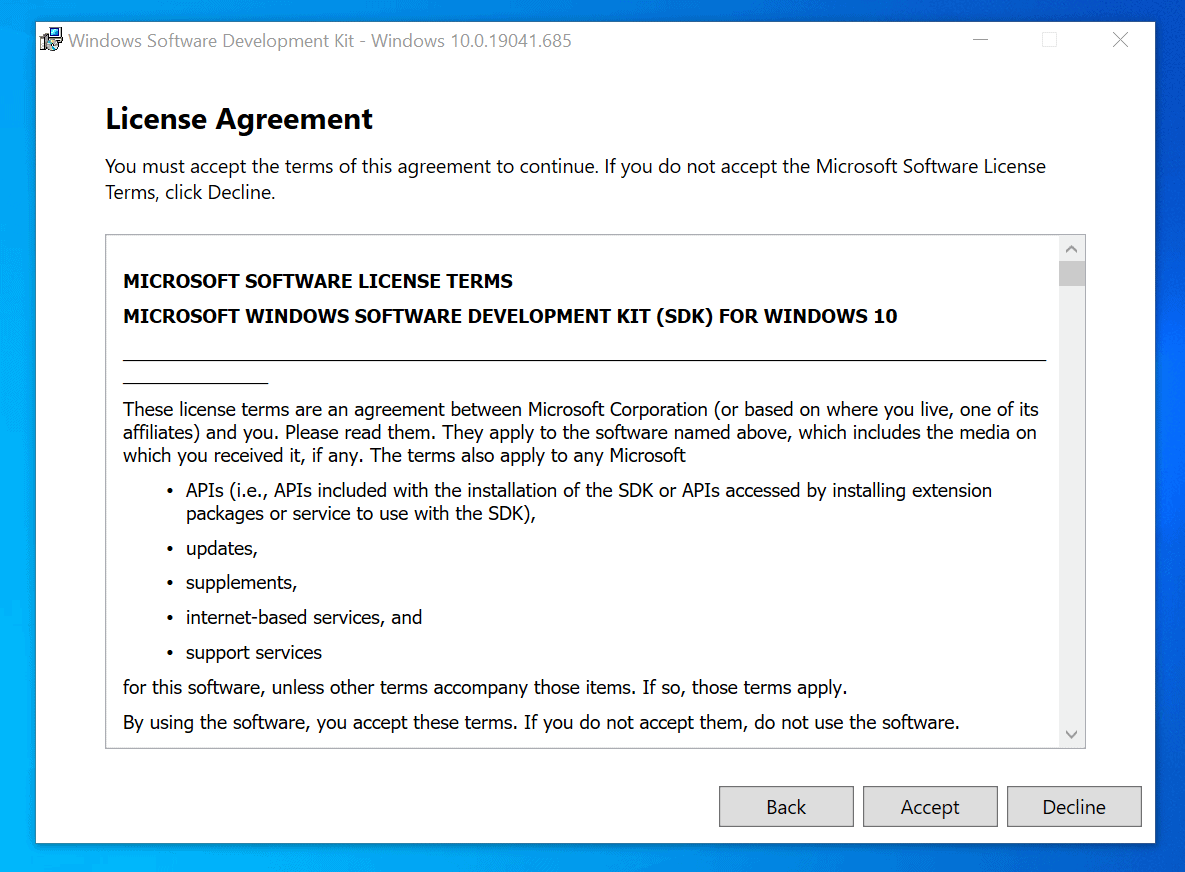
- When the Licence Agreement screen loads, on the bottom right, click Accept.
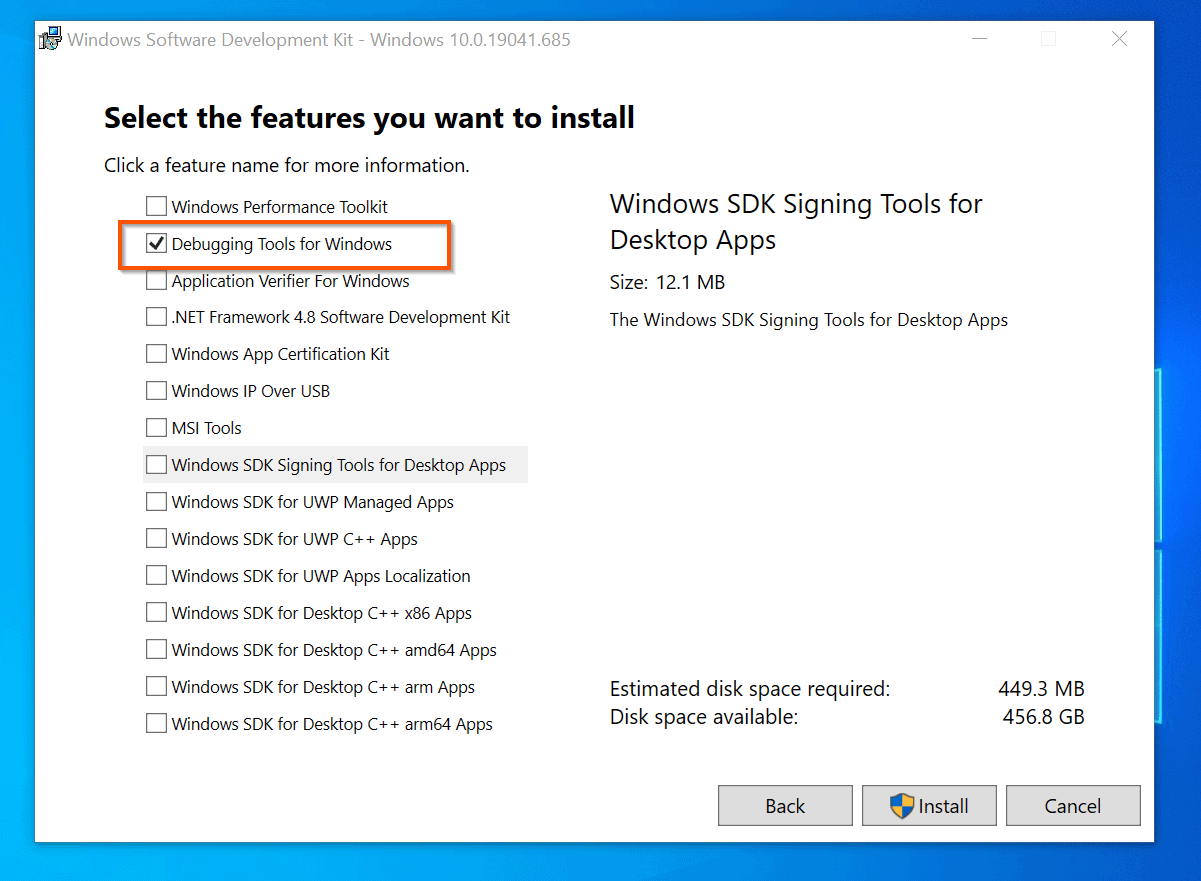
- Finally, to install the Windows Debugging Tool that you need to read Windows 10 crash log, on the “Select the features you want to install” screen, uncheck all other features but leave Debugging Tools for Windows checked.
- Finally, click Install and wait for the installation to complete.
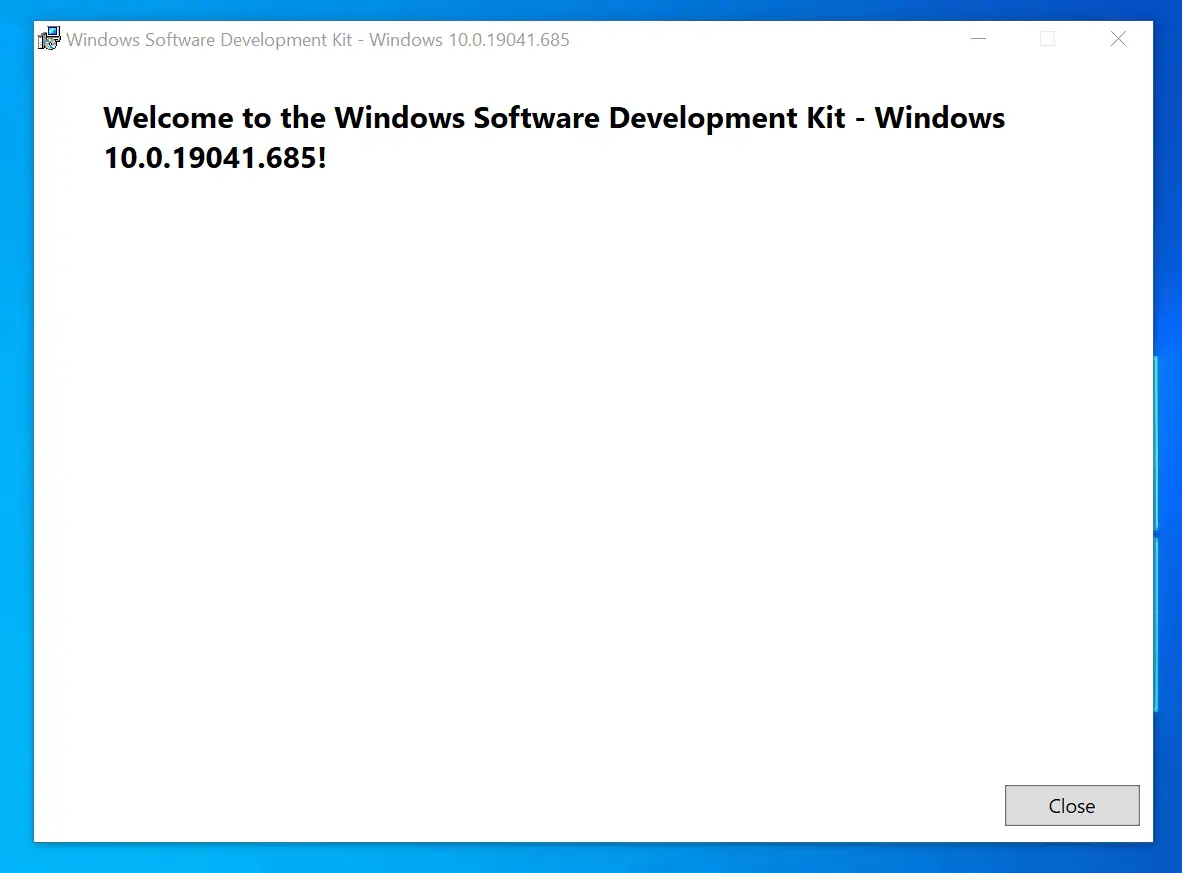
- When the installation is completed, click Close and proceed to step 2 below –
Step 2: Get the Path to the Windows Crash Dump File
Obviously, you need the path to the Windows 10 crash log files to be able to open it. If you do not know the path to the crash dump files, follow the steps below to find it.
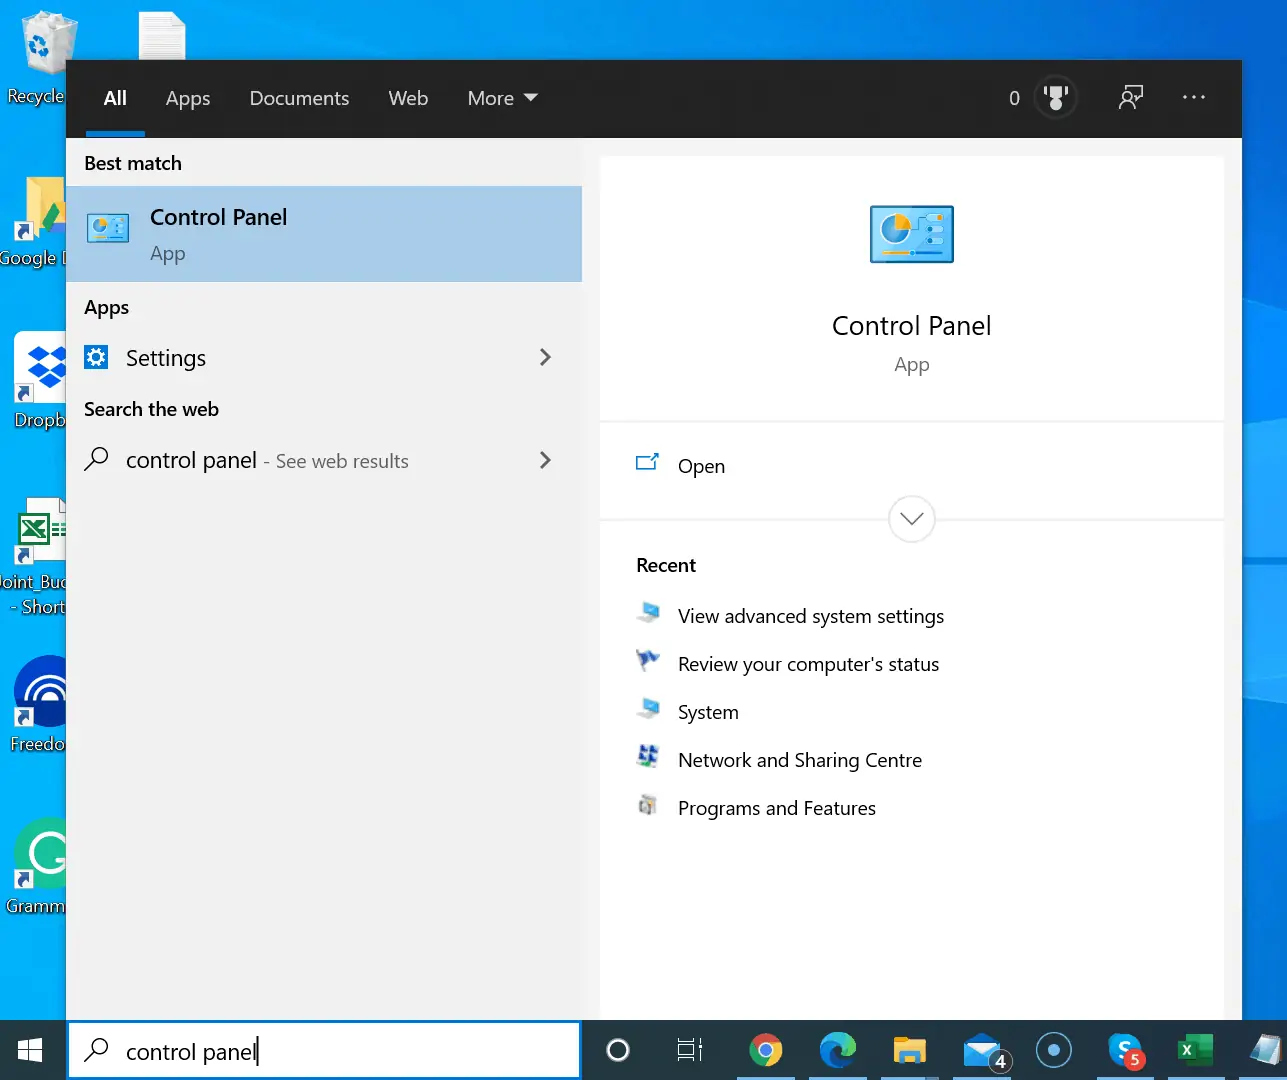
- On the Windows 10 search box, type control panel. Then, from the search result, select Control Panel.
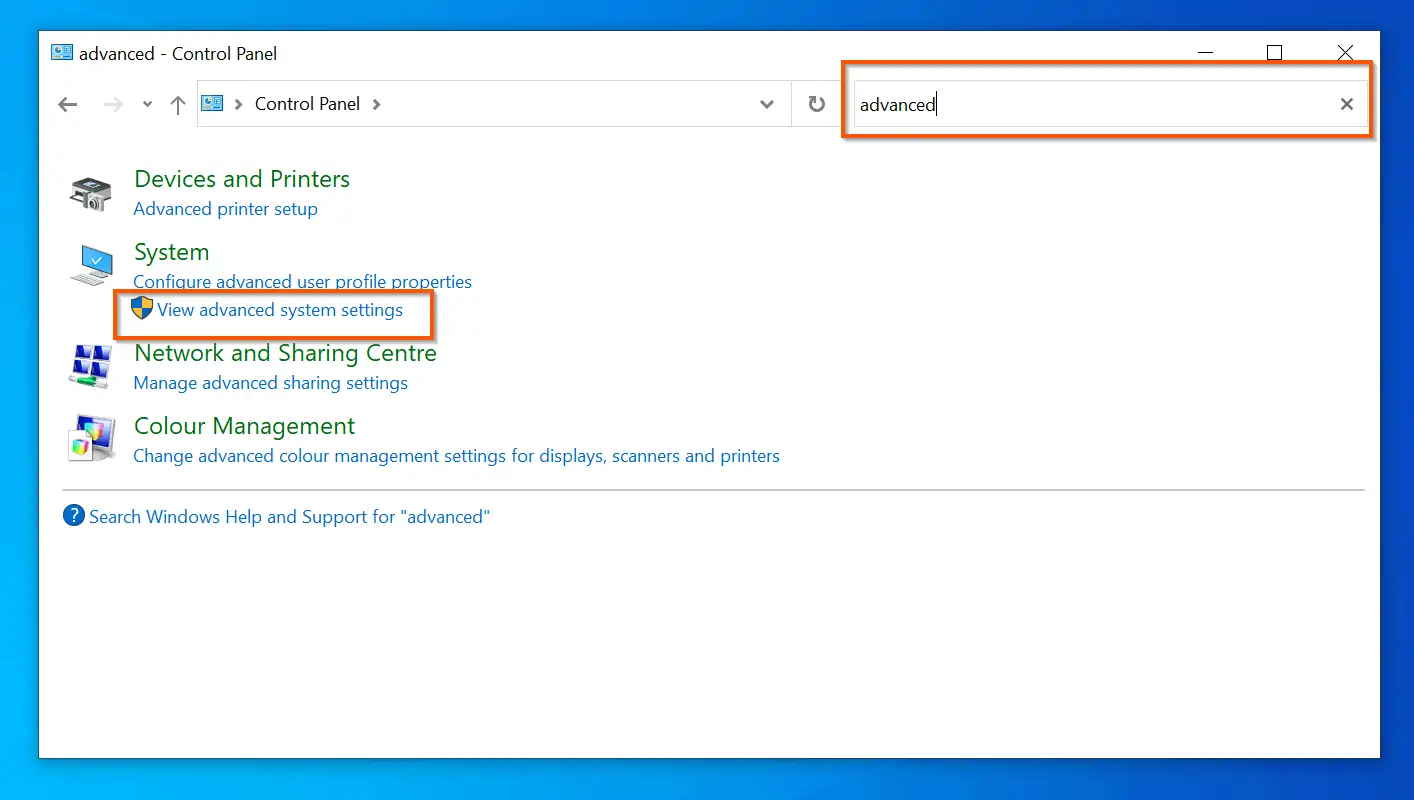
- Then, on the top right of Control Panel, type advanced into the search box. Furthermore, from the search results, click View advanced system settings.
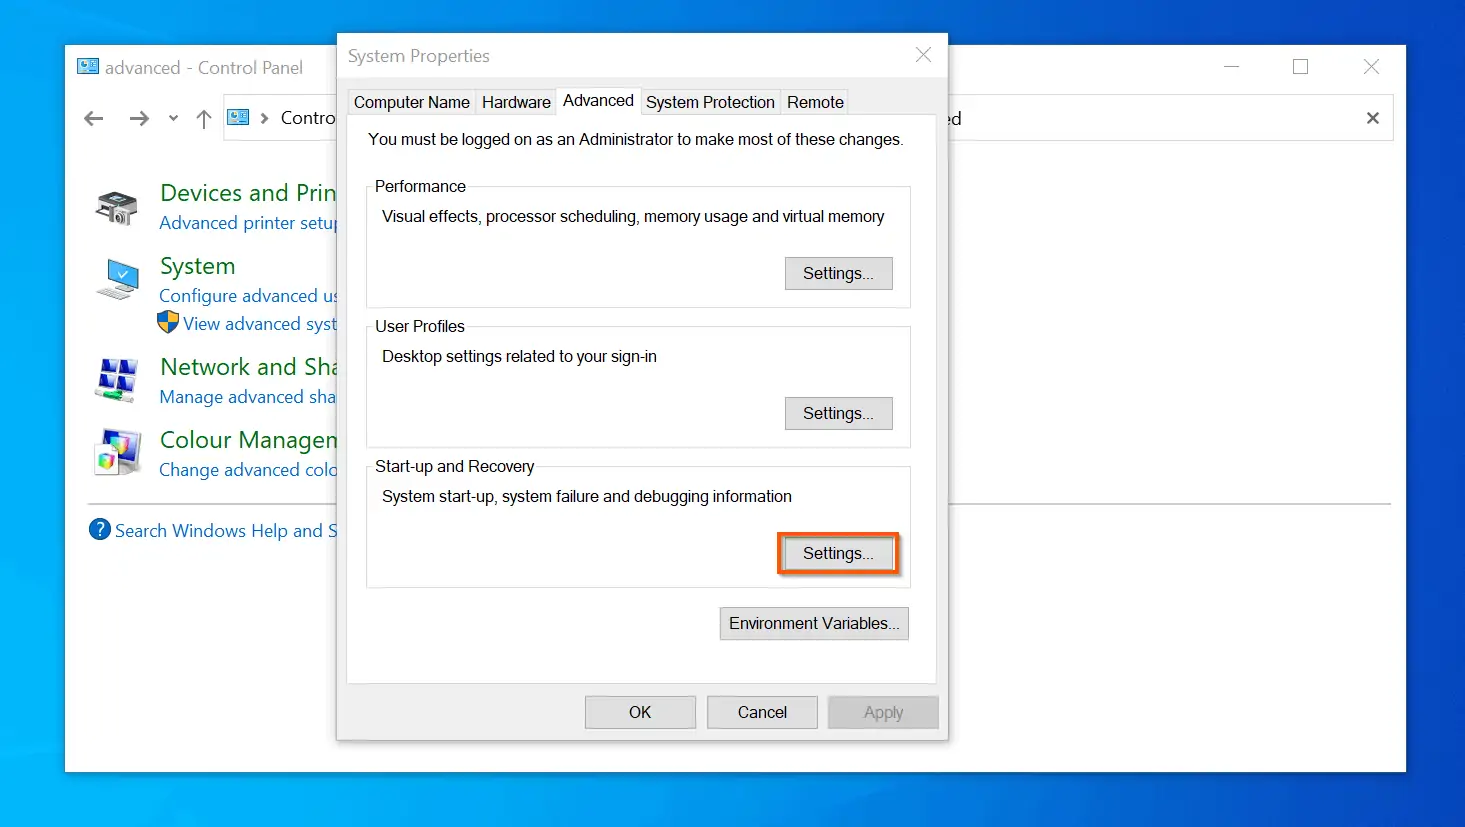
- On the System Properties Advanced tab – Start-up and Recovery section – click Settings.
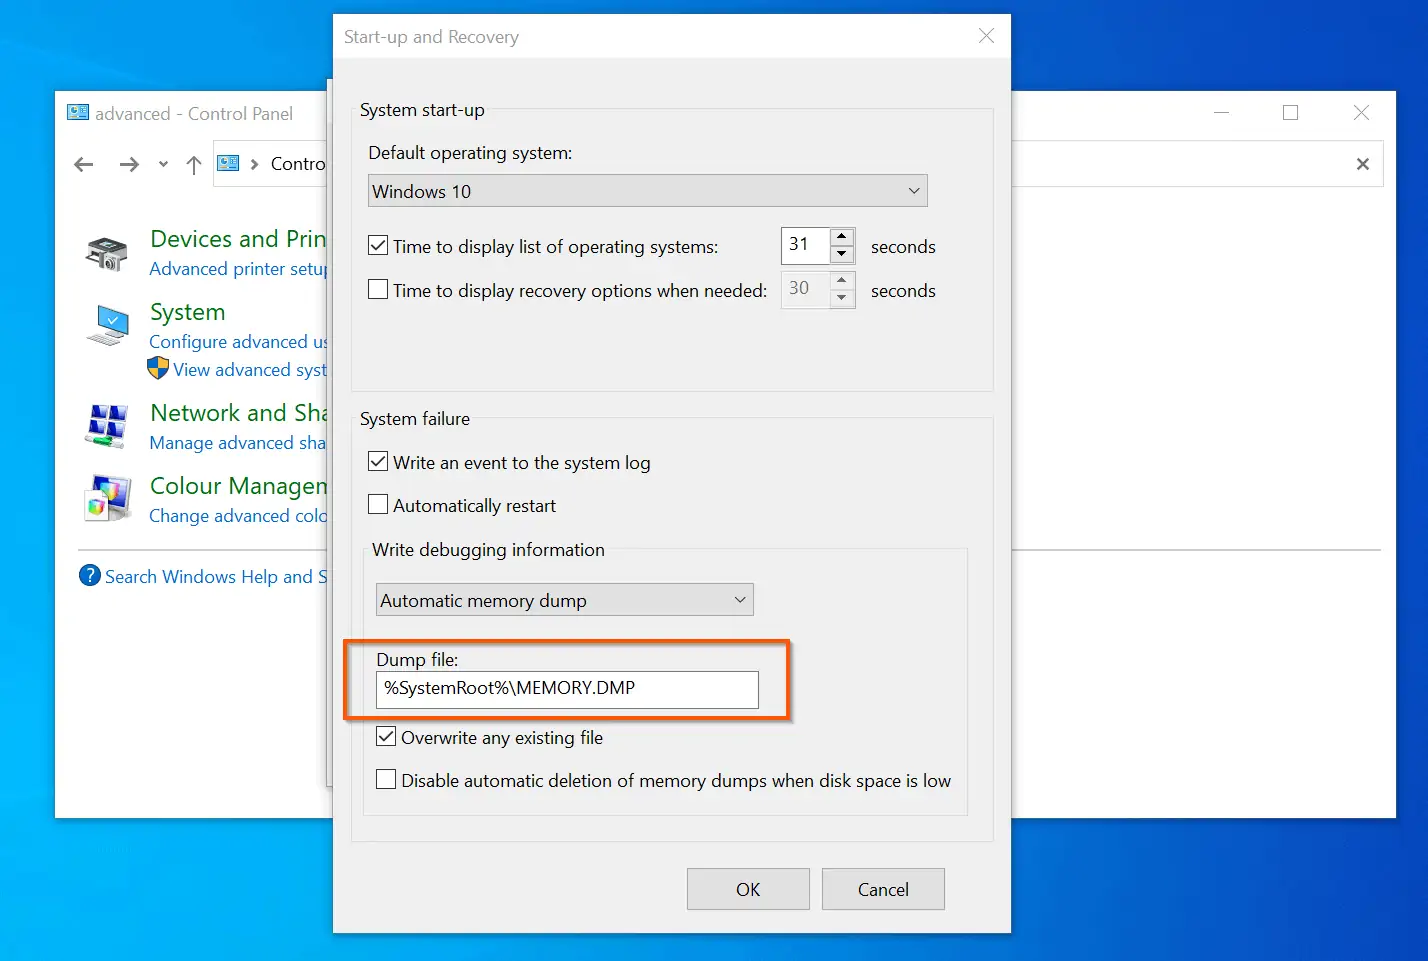
- Finally, copy the Windows 10 crash log file path on the “Dump file” field. Then, proceed to the last step.
Step 3: Open and Read Crash Log with the Debugging Tool
Now that you have installed the Windows Debugging Tool and determined path to the crash dump file, follow the steps below to read the file.
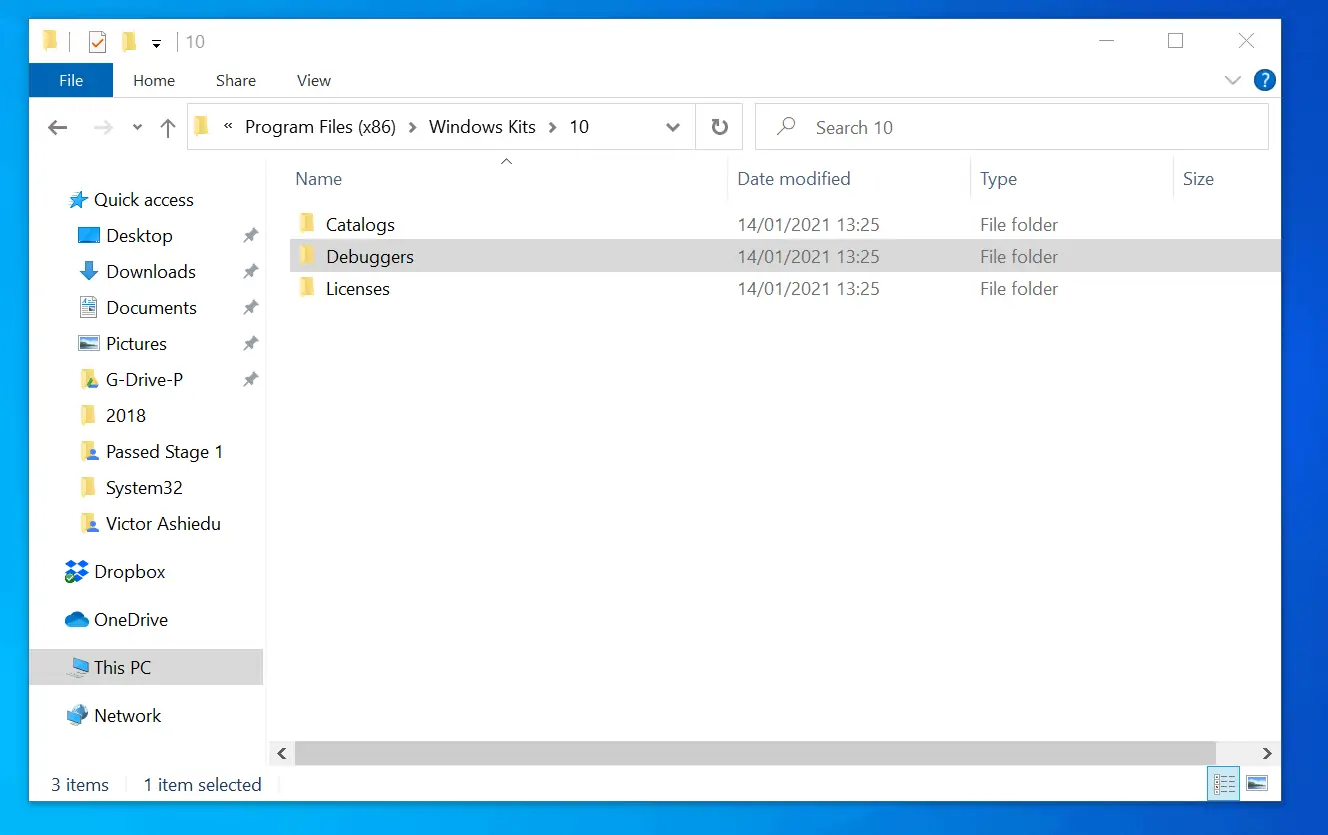
- Open the path you installed the SDK tool. Then, open the “Debuggers” folder – see the second screenshot below.
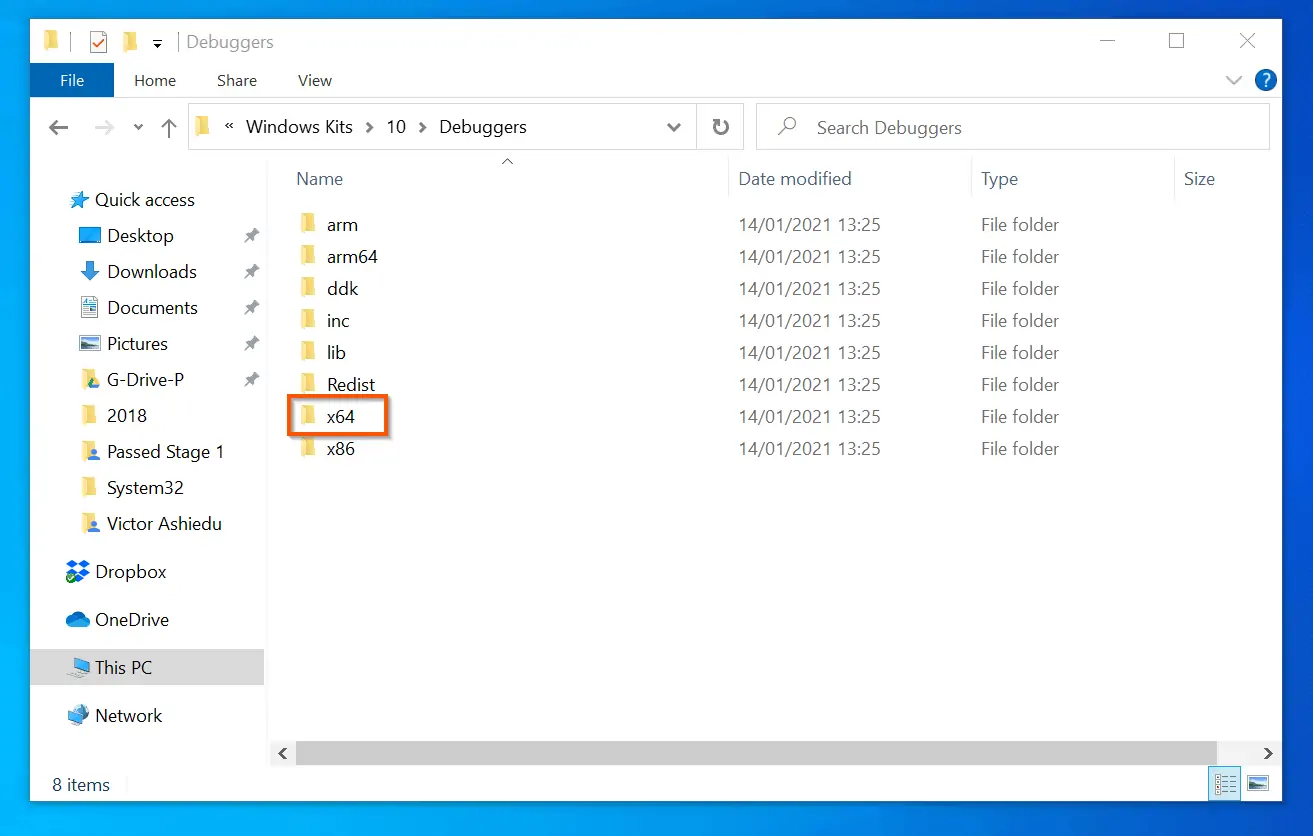
- Furthermore, on the “Debuggers” folder, open the folder for your Windows 10 processor architecture – it is likely the x64 folder.
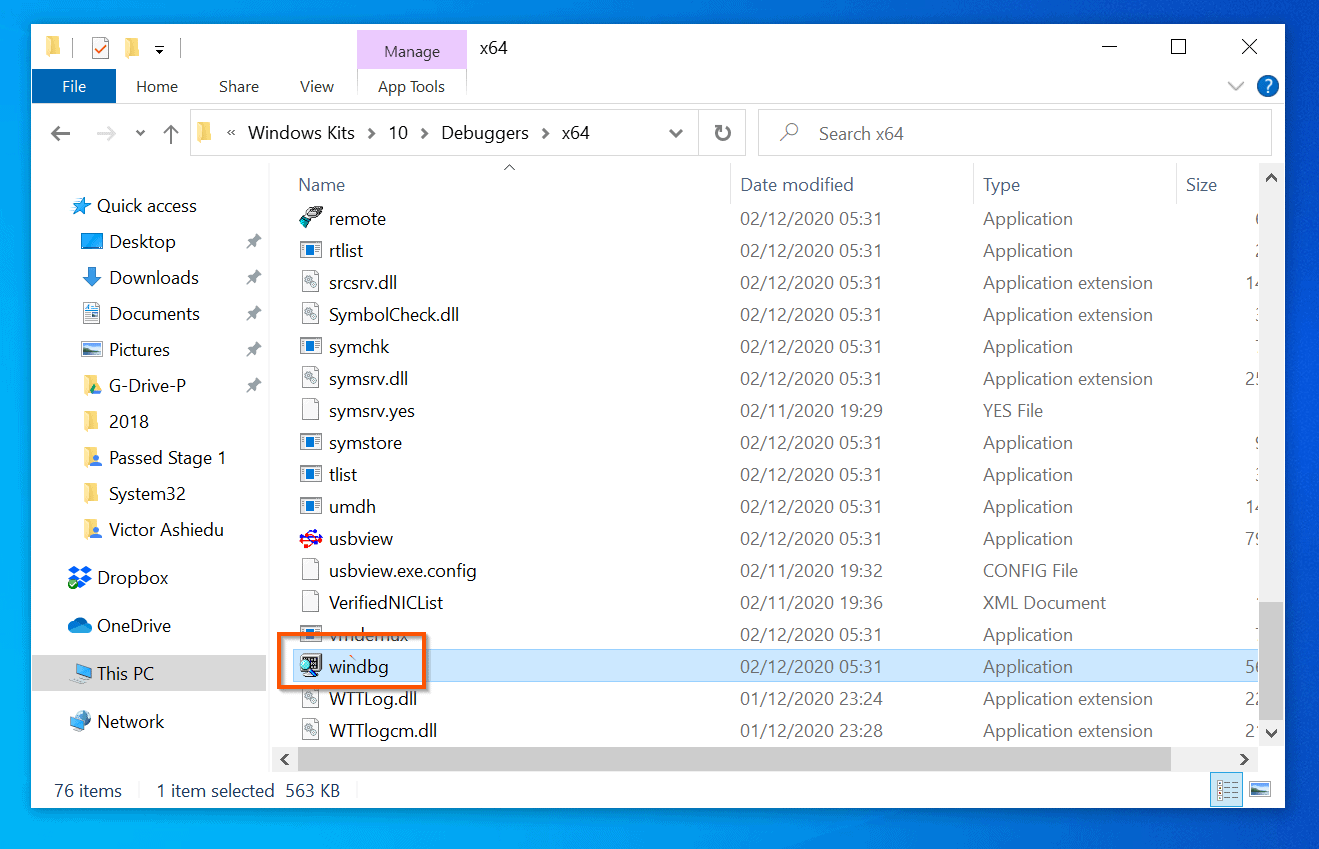
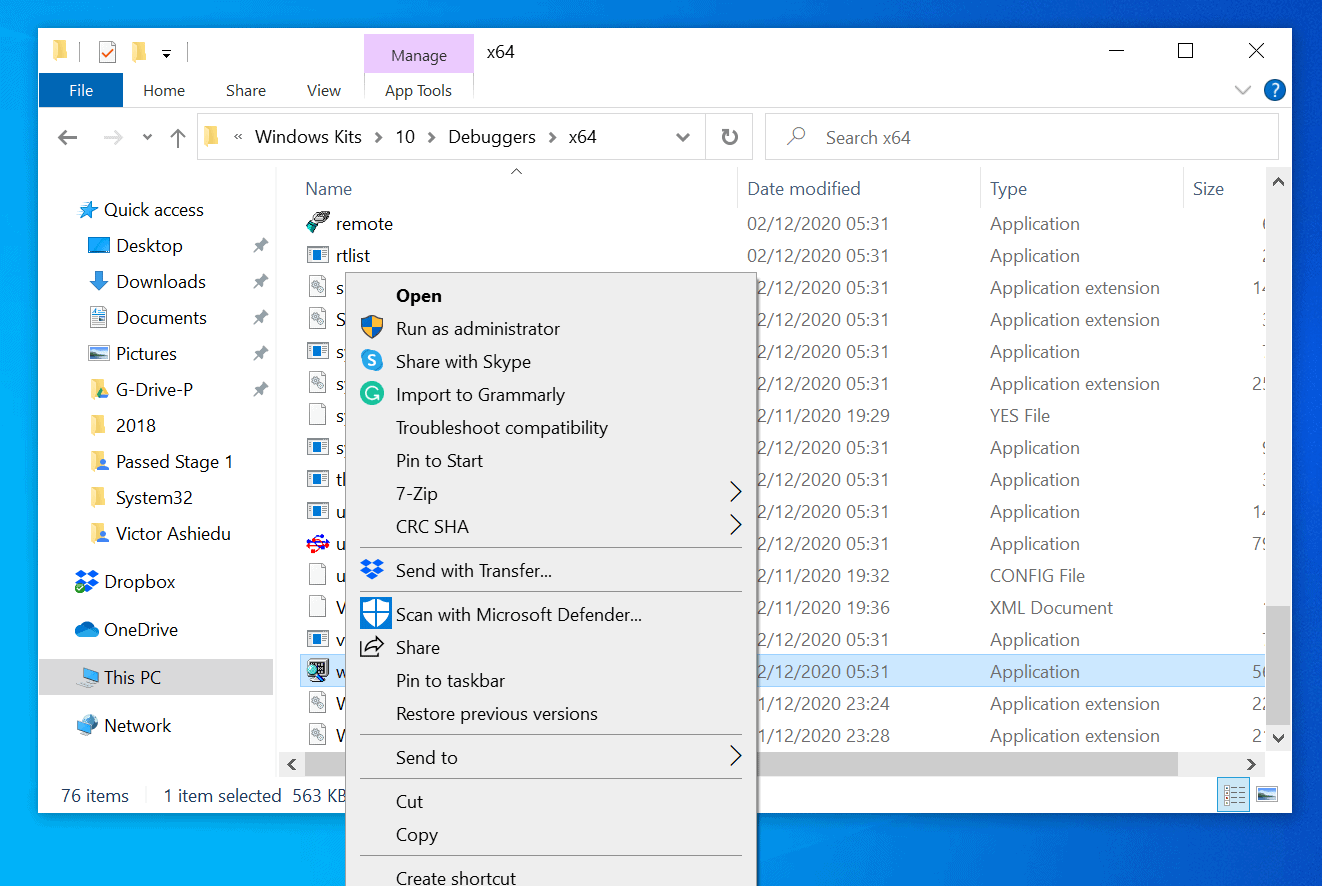
- Next, locate windbg, right-click it and select Run as administrator.
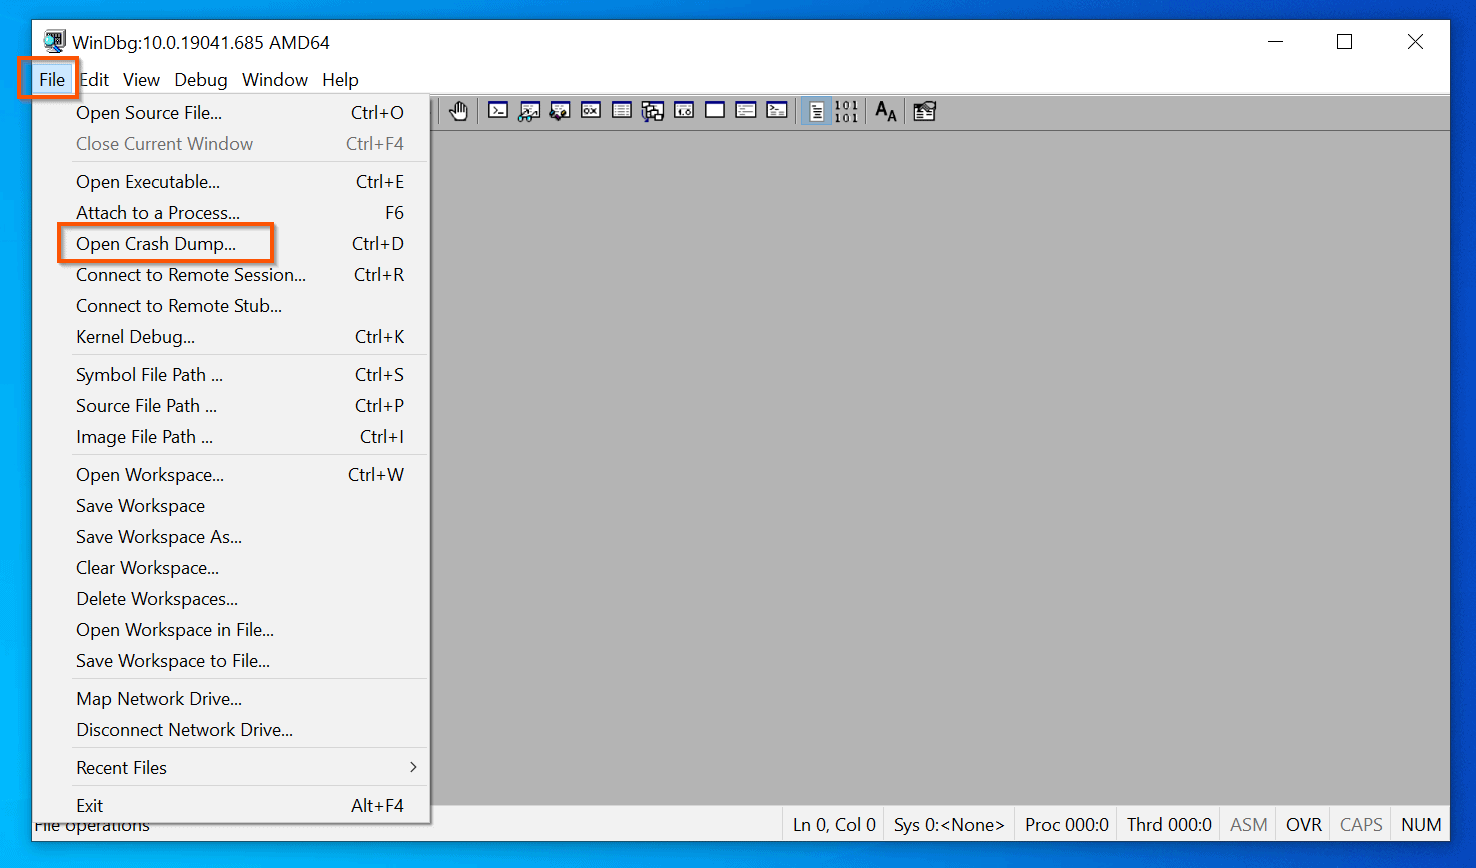
- Moving on, on the top left of the windbg debugging tool, click File. Then, from the displayed options, select Open Crash Dump…
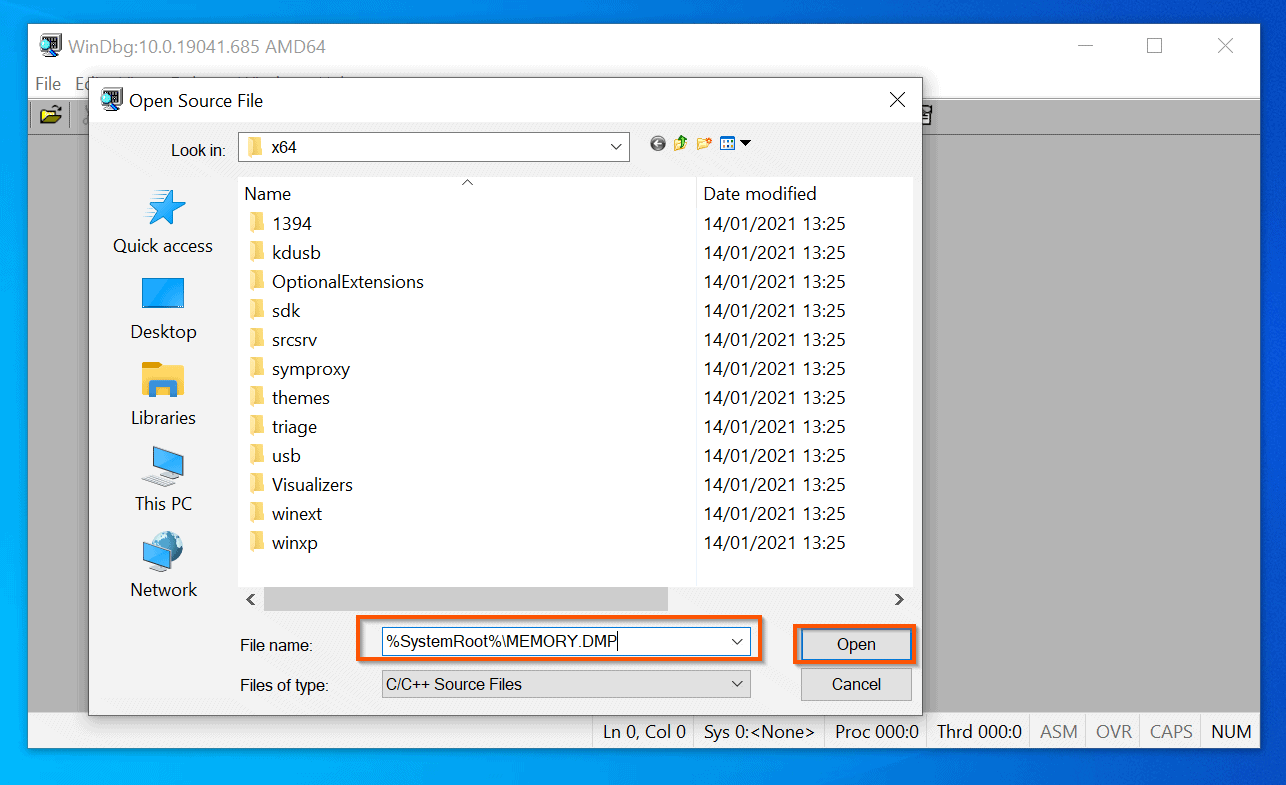
- Then, paste the path to the dump file you copied in step 2 earlier and click Open. The crash dump file will open in the debugger – see the second screenshot below.
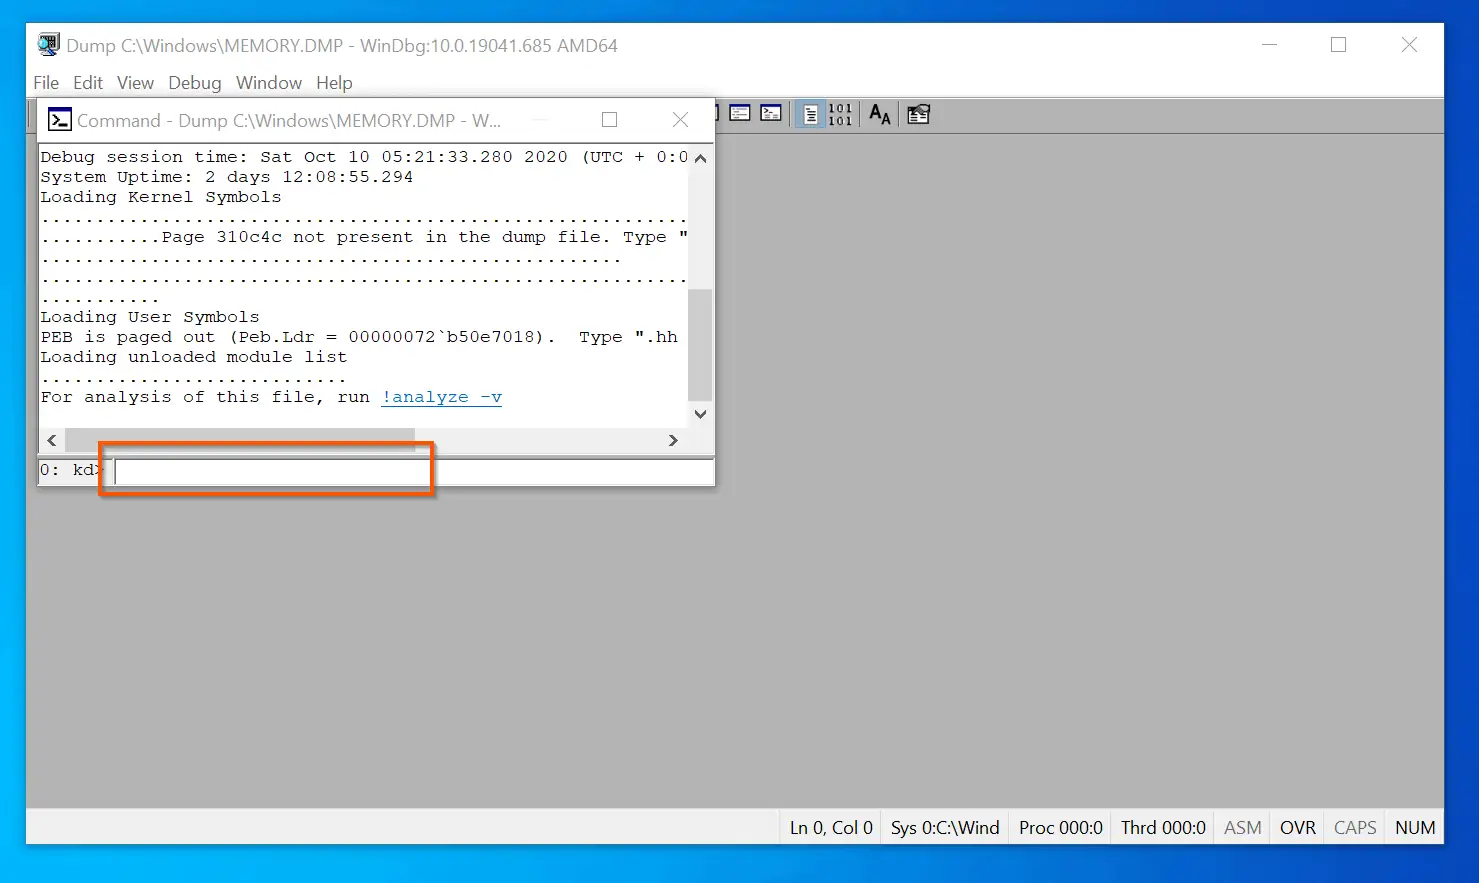
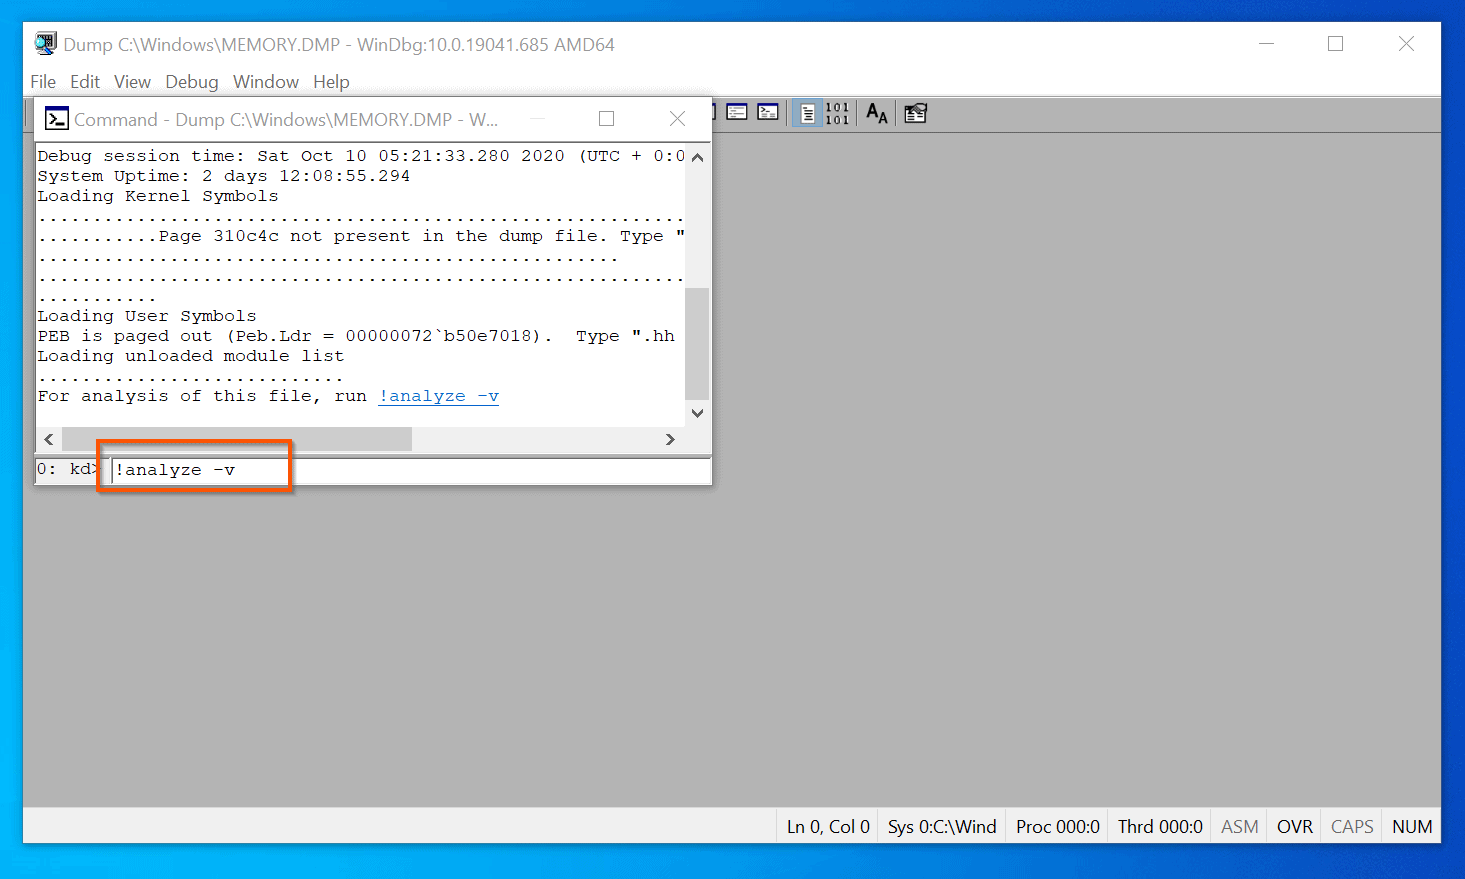
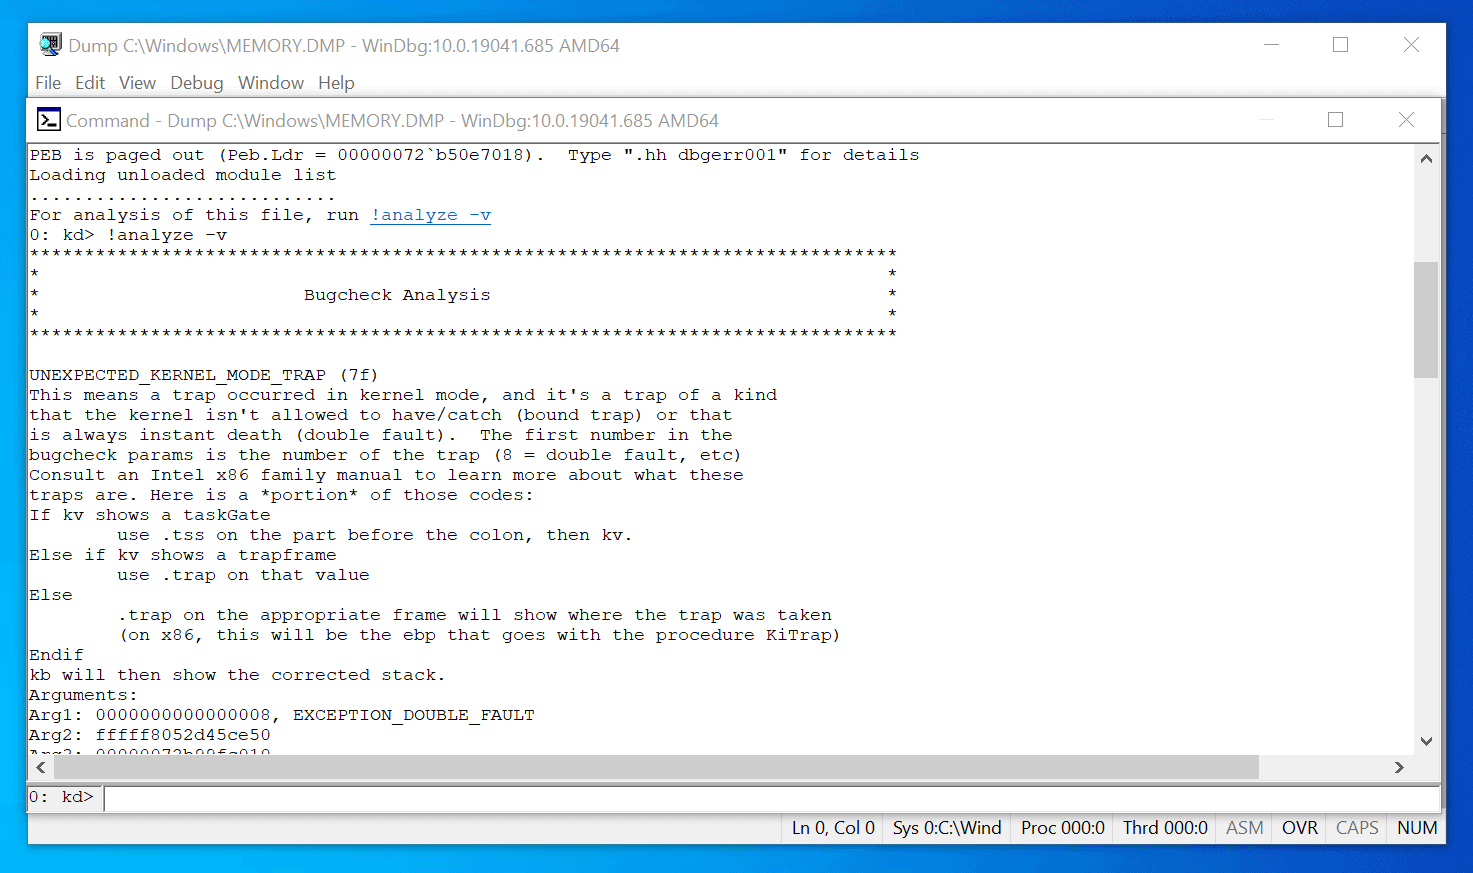
- To analyze the crash dump log file, enter the command below in the command prompt and click the Enter key on your keyboard.
!analyze -v
- The debugger will analyze the dump file. When it finishes, to read the results, expand the file.
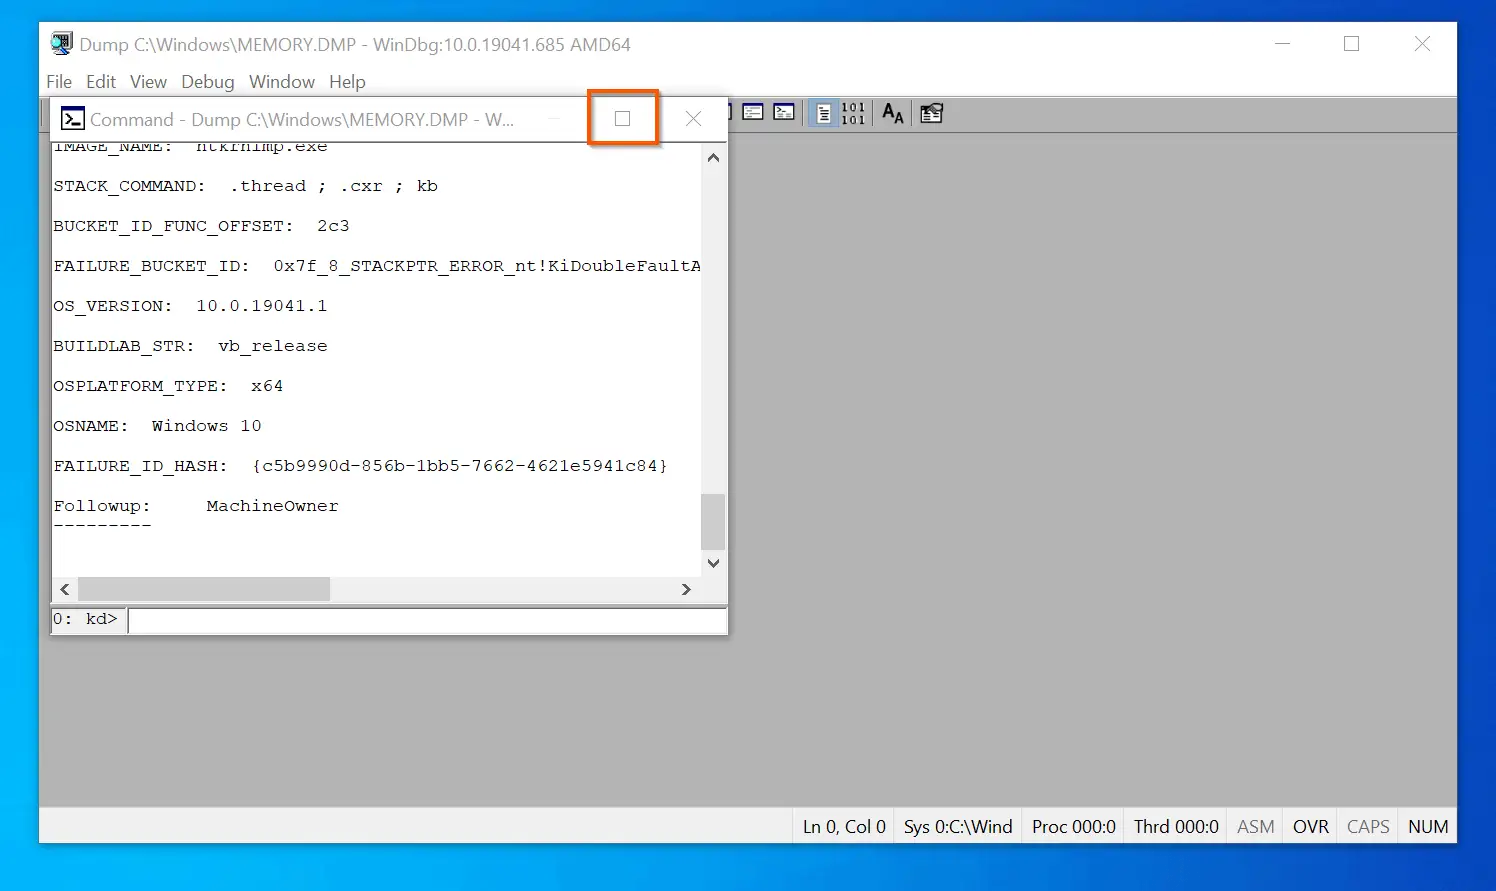
- Finally, now that you have opened Windows 10 crash log dump file and analyzed it, you can scroll through for errors that may have caused your OS to crash.
Conclusion
I hope you found the guide helpful and you were able to successfully open a Windows 10 crash log dump file.
If you found it helpful, kindly spare 2 minutes to share your thoughts by responding to the “Was this page helpful?” question below.
Finally, for more Windows 10 Itechguides, visit our Windows 10 How-to page. You may also find our Work from Home page very helpful.


![How To Run Sysprep (Generalize) In Windows 10 [2 Methods]](https://www.itechguides.com/wp-content/uploads/2022/05/8-2.webp)