Variance measures the spread between numbers in a data set. You can calculate variance in Excel using the VAR, VAR.S, VARP or VAR.P.
Option 1: Calculate Variance with Sample of a Population
The image below column A contains a data set.
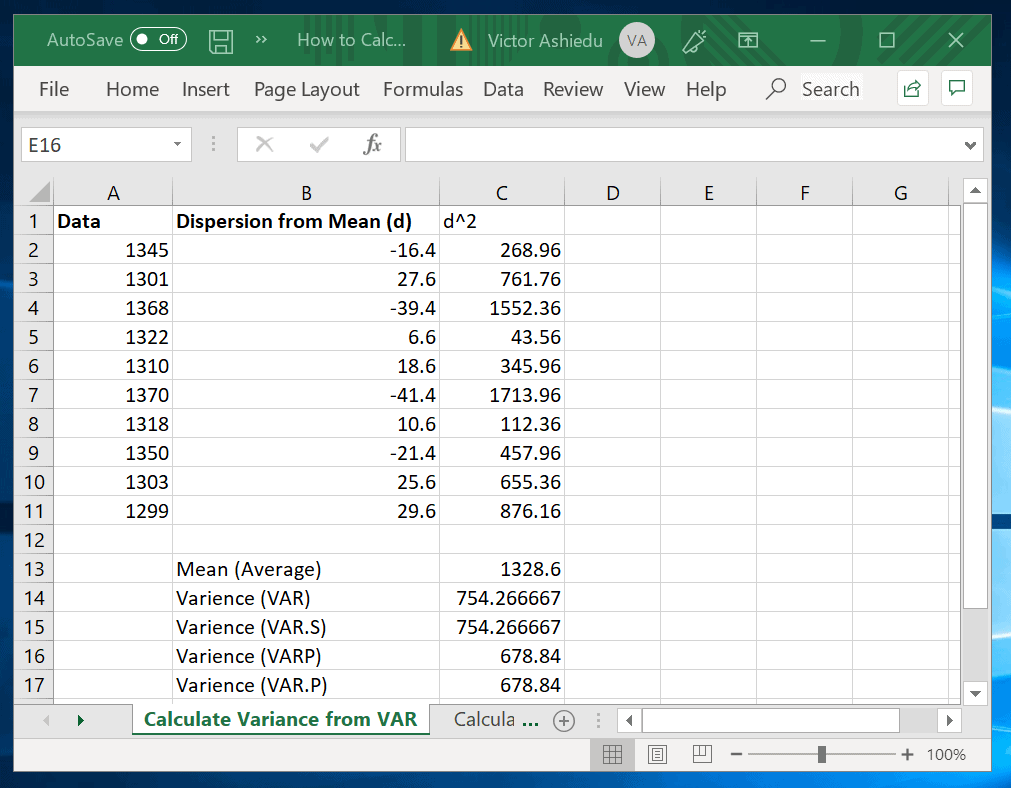
To calculate variance in Excel using the sample data shown above, use the VAR.S function.
The syntax of VAR.S function is
VAR.S(number1,[number2],...)
Number1 (required) – represents the first number in a sample of a population
Number2 (optional) – represents a number between 2 to 254 in a sample of a population
Important Notes
- Use the VAR.S function if your data set represents a sample of the population. If your data represents the entire population, use VAR.P to compute your variance instead.
- Number1, Number2 etc can either be numbers or names, arrays, or references that contain numbers.
- If the input of VAR.S is an array or reference, only numbers in that array or reference are counted.
- To include logical values and text representations of numbers in a reference to your calculation, use the VARA function.
- VAR.S uses the formula below:

In the formula above, x is the Mean of the sample. The Mean is calculated using AVERAGE(number1,number2,…). n is the sample size.
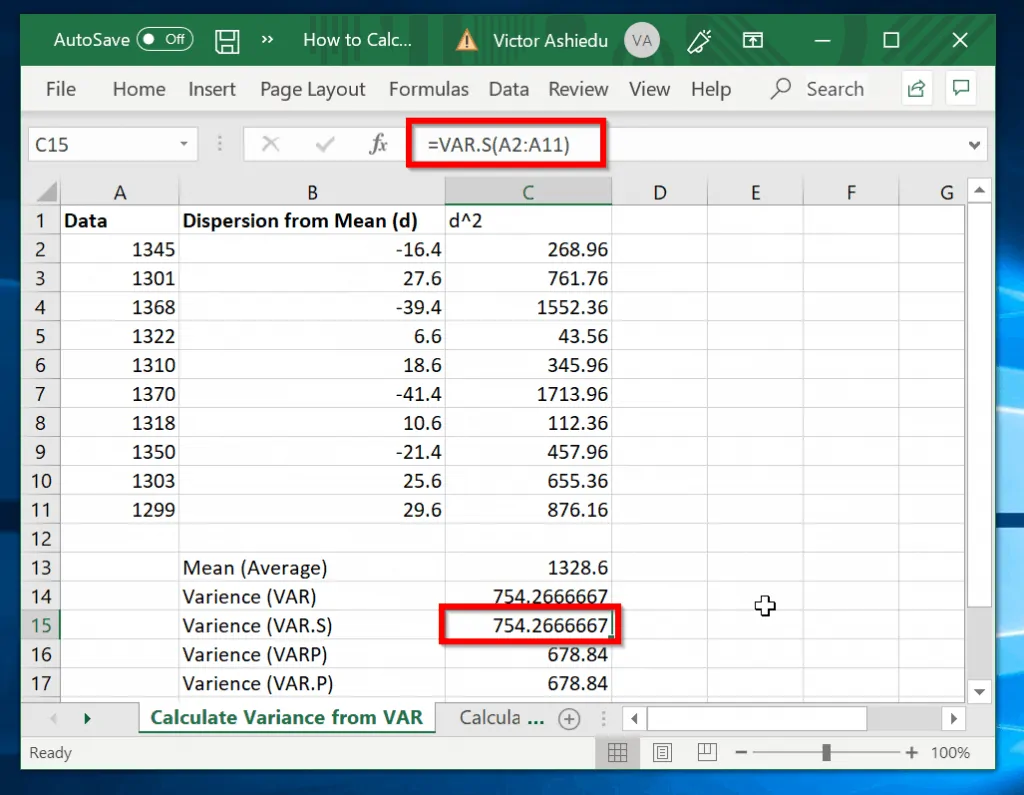
Using the data shown in the previous image, to calculate the variance, use the formula below:
=VAR.S(A2:A11)
Here is the result in Excel
Option 2: Calculate Variance with Entire Population
In the last section I showed how to calculate variance using sample of a data set. If you want to use the entire population you need to use the VAR.P function.
The syntax of the VAR.P is similar to VAR.S.
To calculate the variance of the entire population shown in the previous image, use this formula:
=VARP(A2:A11)
The result is shown below:
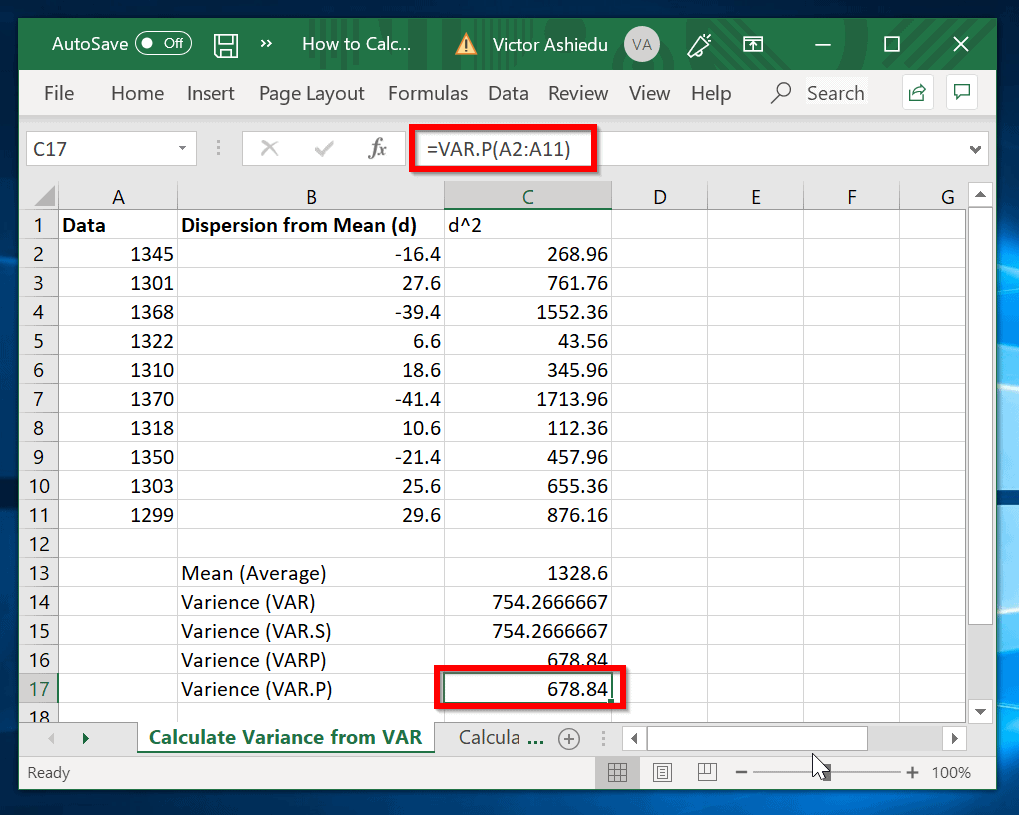
As you can see from the result, the result is different from the the result for VAR.S function.
Option 3: Calculate Variance from Mean
So far I have shown how to calculate variance in Excel using the VAR.S and VAR.P functions.
In this section, I will show how to calculate variance in Excel using the Mean of a sample population.
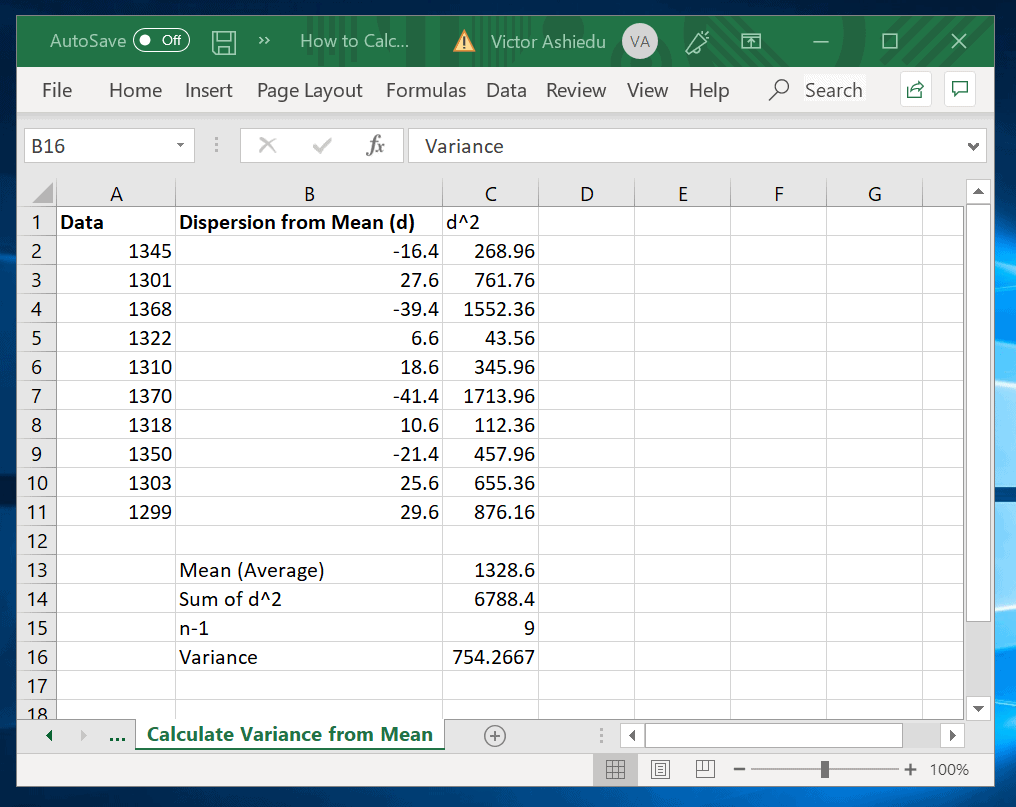
The worksheet in the image below will be referenced in this demo.
The next steps show how to use the formula below to calculate variance:
Here are the steps:
- Calculate the Mean (Average) of the sample using the formula:
=AVERAGE(A2:A11)
The result is shown in cell C13 (See the image above).
- Next, calculate the dispersion of each of the sample from their Mean. To do this, subtract each sample data from the Mean. The results are in cells B2 to B11.
- Then square the dispersion from the Mean. Cells C2 to C11 contains the squared values.
- Next, sum the squared values. The result of the sum is 6788.4. See cell C14.
- The next step is to count the total sample and subtract 1 from it. Here is the formula used (C15).
=COUNT(A2:A11)-1
- Finally, to calculate the variance divide C14 by C15. The formula is in cell C16
=C14/C15
The result is 754.2667. The same value we got with VAR.S function.
Conclusion
Variance calculation using Excel is very straight forward. In this guide I showed various ways you can calculate variance in Excel.
In the last section you saw how to perform variance calculation from the Mean of a sample. Use this if you need to show steps to calculate variance.
If you were able to calculate Variance in Excel by following the steps in this guide, kindly spare 1 minute to let us know by responding to the “Was this page helpful?” question below.
Alternatively, you can share your experience with our community using the comment (“Leave a Reply”) form at the bottom of this page.