Standard Deviation is a measure of how dispersed values are from their mean (average). You can calculate standard deviation in Excel with STDEV, STDEVP, STDEV.S or STDEV.P Functions.
Option 1: Calculate Sample Standard Deviation
STDEV and STDEV.S (newer version of STDEV) functions are used to calculate standard deviation based on sample of a population.
When you use any of these functions, Excel assumes that its inputs are a sample of the population, not the entire population.
To calculate standard deviation in Excel based on the entire population it is better to use the STDEVP function.
This section covers how to use STDEV, STDEV.S STDEVP and STDEV.P functions.
Method 1: Calculate Sample Standard Deviation with STDEV and STDEV.S Functions
The syntax of STDEV and STDEV.S functions are:
STDEV(number1,[number2],...)
STDEV.S(number1,[number2],...)
Number1 (required) – represents the first number in a sample of a population
Number2 (optional) – represents a number between 2 to 255 in a sample of a population
Important Notes
- The formulas assume that the data supplied are samples of the population.
- If your data represents an entire population use STDEVP and STDEV.P functions instead. These are covered in the next section
- STDEV and STDEV.S use the “n-1” method to calculate the standard deviation
- Number1, number2, etc can either be numbers or names, arrays, or references that contain numbers.
- If any of the values included in STDEV or STDEV.S formula arguments reference a cell that contains text, those cells are ignored.
- If your sample data include logical values and text representations of numbers, use the STDEVA function instead.
- STDEV and STDEV.S use the formula below to calculate standard deviation in Excel:

The formula above is the square root (SQRT) of the variance (VAR) of the sample.
In the formula, x is the sample Mean AVERAGE(number1,number2,…) while n is the sample size.
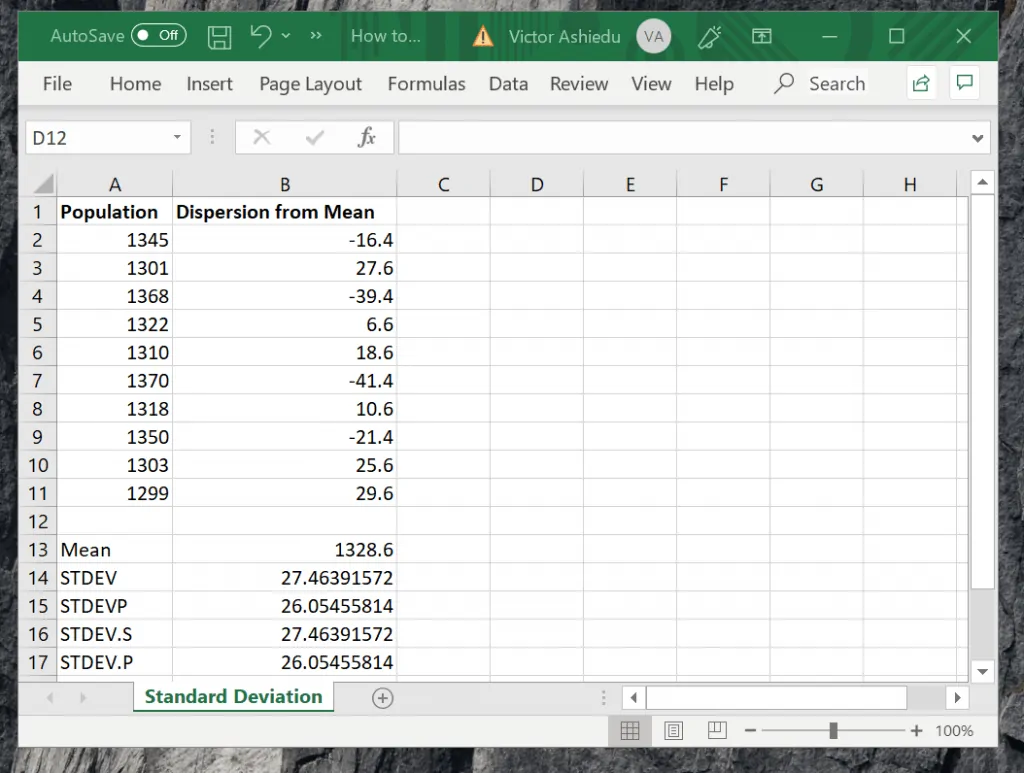
To calculate Sample standard deviation for the data shown in cells A2 to A11 use the formula
=STDEV(A2:A11)
The result is 27.46391572 (cell B14).
To use the newer function, STDEV.S use this formula
STDEV.S(A2:A11)
Method 2: Calculate Standard Deviation with STDEVP and STDEV.S Functions
As I mentioned in the last section STDEV and STDEV.S functions assume that the input data are samples. To calculate standard deviation for an entire population use STDEVP and STDEV.S.
Using the data shown in the last section, to calculate standard deviation for the whole population, use the formulas below:
=STDEVP(A2:A11)
=STDEV.P(A2:A11)
The result of both formula is 26.05455814.
Option 2: Calculate Standard Deviation from Mean
I said earlier that the standard deviation functions use the formula below:
In this section I will demonstrate how to compute standard deviation from the mean (Average) of a sample data using the formula shown above.
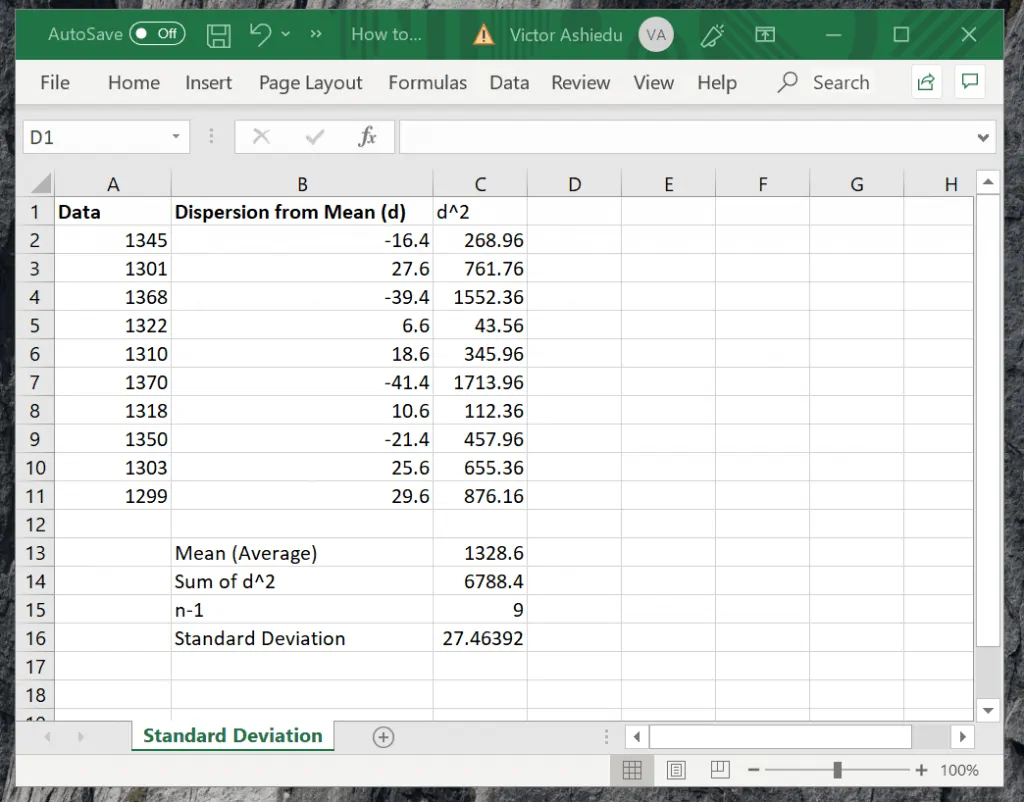
This section will reference the worksheet shown below. Column A contains the sample data.
To calculate standard deviation using the formula above, follow the steps below:
- Calculate the Mean of the sample with the formula below:
=AVERAGE(A2:A11)
- Next, calculate the dispersion of each sample data in column A from the above Mean. This is shown in cells B2 to B11 in the image below:
- Then square each of the dispersion values. This was done in column C (See the the image above).
- The squared values are then summed in cell C14.
- Next, count the sample data and subtract 1 from the total. The formula used is:
=COUNT(A2:A11)-1
and the result is 9, shown in Cell C15.
- Finally, take the square root of C14/C15 (C14 divided C15) as shown below:
=SQRT(C14/C15)
The result is 27.46392. The exact value returned by the STDEV and STDEV.S functions.
Conclusion
Standard deviation calculation using Excel is very straight forward. In this guide, I showed various ways you can calculate standard deviation in Excel.
In the last section, you saw how to perform the same calculation from the Mean of a sample.
If you were able to calculate Standard Deviation in Excel by following the steps in this guide, kindly let us know by responding Yes to the “Was this page helpful?” question below. Otherwise, respond No and let us know how the article fell short.